IBM 2014 Annual Report Download - page 64
Download and view the complete annual report
Please find page 64 of the 2014 IBM annual report below. You can navigate through the pages in the report by either clicking on the pages listed below, or by using the keyword search tool below to find specific information within the annual report.-
 1
1 -
2
-
3
-
4
-
5
-
6
-
7
-
8
-
9
-
10
-
11
-
12
-
13
-
14
-
15
-
16
-
17
-
18
-
19
-
20
-
21
-
22
-
23
-
24
-
25
-
26
-
27
-
28
-
29
-
30
-
31
-
32
-
33
-
34
-
35
-
36
-
37
-
38
-
39
-
40
-
41
-
42
-
43
-
44
-
45
-
46
-
47
-
48
-
49
-
50
-
51
-
52
-
53
-
 54
54 -
 55
55 -
 56
56 -
 57
57 -
 58
58 -
 59
59 -
 60
60 -
 61
61 -
 62
62 -
 63
63 -
 64
64 -
 65
65 -
 66
66 -
 67
67 -
 68
68 -
 69
69 -
 70
70 -
 71
71 -
 72
72 -
 73
73 -
 74
74 -
75
-
76
-
77
-
78
-
79
-
80
-
81
-
82
-
83
-
84
-
85
-
86
-
87
-
88
-
89
-
90
-
91
-
92
-
93
-
94
-
95
-
96
-
97
-
98
-
99
-
100
-
101
-
102
-
103
-
104
-
105
-
106
-
107
-
108
-
109
-
110
-
111
-
112
-
113
-
114
-
115
-
116
-
117
-
118
-
119
-
120
-
121
-
122
-
123
-
124
-
125
-
126
-
127
-
128
-
129
-
130
-
131
-
132
-
133
-
134
-
135
-
136
-
137
-
138
-
139
-
140
-
141
-
142
-
143
-
144
-
145
-
146
-
147
-
148
-
149
-
150
-
151
-
152
-
153
-
154
-
155
-
156
-
157
-
158
 |
 |

63
Management Discussion
International Business Machines Corporation and Subsidiary Companies
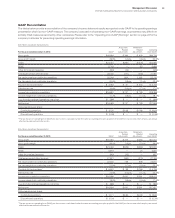
GAAP Reconciliation
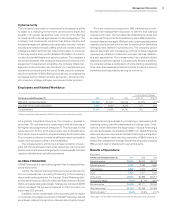
The tables below provide a reconciliation of the company’s income statement results as reported under GAAP to its operating earnings
presentation which is a non-GAAP measure. The company’s calculation of operating (non-GAAP) earnings, as presented, may differ from
similarly titled measures reported by other companies. Please refer to the “Operating (non-GAAP) Earnings” section on page 22 for the
company’s rationale for presenting operating earnings information.
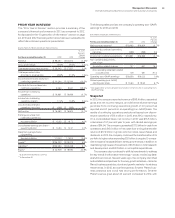
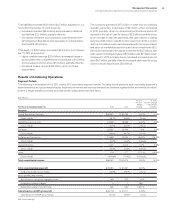
($ in millions except per share amounts)
For the year ended December 31, 2013: GAAP
Acquisition-
Related
Adjustments
Retirement-
Related
Adjustments
Operating
(non-GAAP)
Gross profit $48,684 $ 394 $ 629 $49,706
Gross profit margin 49.5% 0.4 pts. 0.6 pts. 50.5%
SG&A $23,451 $(394) $ (376) $22,680
RD&E 5,743 — (57) 5,686
Other (income) and expense (333) (16) — (349)
Total expense and other (income) 28,440 (410) (433) 27,597
Pre-tax income from continuing operations 20,244 804 1,062 22,110
Pre-tax margin from continuing operations 20.6% 0.8 pts. 1.1 pts. 22.5%
Provision for income taxes* $ 3,363 $ 57 $ 333 $ 3,753
Effective tax rate 16.6% (0.4) pts. 0.7 pts. 17.0%
Income from continuing operations $16,881 $ 747 $ 729 $18,356
Income margin from continuing operations 17.2% 0.8 pts. 0.7 pts. 18.7%
Loss from discontinued operations, net of tax $ (398 ) $ — $ — $ (398 )
Net income $16,483 $ 747 $ 729 $17,959
Diluted earnings per share:
Continuing operations $ 15.30 $0.68 $ 0.66 $ 16.64
Discontinued operations $ (0.36) $ — $ — $ (0.36 )
*
The tax impact on operating (non-GAAP) pre-tax income is calculated under the same accounting principles applied to the GAAP pre-tax income which employs an annual
effective tax rate method to the results.
($ in millions except per share amounts)
For the year ended December 31, 2012: GAAP
Acquisition-
Related
Adjustments
Retirement-
Related
Adjustments
Operating
(non-GAAP)
Gross profit $50,361 $ 376 $ 264 $51,001
Gross profit margin 49.0% 0.4 pts. 0.3 pts. 49.6%
SG&A $23,463 $(349) $(294) $22,820
RD&E 5,816 — 20 5,837
Other (income) and expense (843) (13) — (857)
Total expense and other (income) 27,821 (363) (274) 27,184
Pre-tax income from continuing operations 22,540 739 538 23,817
Pre-tax margin from continuing operations 21.9% 0.7 pts. 0.5 pts. 23.2%
Provision for income taxes* $ 5,541 $ 98 $ 156 $ 5,795
Effective tax rate 24.6% (0.4) pts. 0.1 pts. 24.3%
Income from continuing operations $16,999 $ 641 $ 381 $18,022
Income margin from continuing operations 16.5% 0.6 pts. 0.4 pts. 17.5%
Loss from discontinued operations, net of tax $ (395) $ — $ — $ (395)
Net income $16,604 $ 641 $ 381 $17,627
Diluted earnings per share:
Continuing operations $ 14.71 $0.56 $0.33 $ 15.60
Discontinued operations $ (0.34) $ — $ — $ (0.34 )
* The tax impact on operating (non-GAAP) pre-tax income is calculated under the same accounting principles applied to the GAAP pre-tax income which employs an annual
effective tax rate method to the results.