IBM 2014 Annual Report Download - page 63
Download and view the complete annual report
Please find page 63 of the 2014 IBM annual report below. You can navigate through the pages in the report by either clicking on the pages listed below, or by using the keyword search tool below to find specific information within the annual report.-
 1
1 -
2
-
3
-
4
-
5
-
6
-
7
-
8
-
9
-
10
-
11
-
12
-
13
-
14
-
15
-
16
-
17
-
18
-
19
-
20
-
21
-
22
-
23
-
24
-
25
-
26
-
27
-
28
-
29
-
30
-
31
-
32
-
33
-
34
-
35
-
36
-
37
-
38
-
39
-
40
-
41
-
42
-
43
-
44
-
45
-
46
-
47
-
48
-
49
-
50
-
51
-
52
-
 53
53 -
 54
54 -
 55
55 -
 56
56 -
 57
57 -
 58
58 -
 59
59 -
 60
60 -
 61
61 -
 62
62 -
 63
63 -
 64
64 -
 65
65 -
 66
66 -
 67
67 -
 68
68 -
 69
69 -
 70
70 -
 71
71 -
 72
72 -
 73
73 -
74
-
75
-
76
-
77
-
78
-
79
-
80
-
81
-
82
-
83
-
84
-
85
-
86
-
87
-
88
-
89
-
90
-
91
-
92
-
93
-
94
-
95
-
96
-
97
-
98
-
99
-
100
-
101
-
102
-
103
-
104
-
105
-
106
-
107
-
108
-
109
-
110
-
111
-
112
-
113
-
114
-
115
-
116
-
117
-
118
-
119
-
120
-
121
-
122
-
123
-
124
-
125
-
126
-
127
-
128
-
129
-
130
-
131
-
132
-
133
-
134
-
135
-
136
-
137
-
138
-
139
-
140
-
141
-
142
-
143
-
144
-
145
-
146
-
147
-
148
-
149
-
150
-
151
-
152
-
153
-
154
-
155
-
156
-
157
-
158
 |
 |
62 Management Discussion
International Business Machines Corporation and Subsidiary Companies
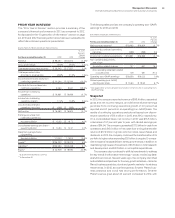
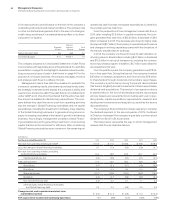
Financial Position
Cash and marketable securities at December31, 2013 were
$11,066 million, consistent with the prior year-end balance. During
the year the company continued to manage the investment portfo-
lio to meet its capital preservation and liquidity objectives.
Total debt of $39,718 million increased $6,449 million from
the December31, 2012 level. The commercial paper balance at
December31, 2013, was $2,458 million, an increase of $658 mil-
lion. Within total debt, $27,504 million was in support of the Global
Financing business which was leveraged at a 7.2 to 1 ratio. The
company continued to have substantial flexibility in the market.
During 2013, the company completed bond issuances totaling
$10,956 million, with terms ranging from 2 to 12years, and priced
from 0.22 to 3.38percent depending on maturity.
Consistent with accounting standards, the company remea-
sured the funded status of its retirement and postretirement plans
at December31. At December31, 2013, the overall net under-
funded position was $11,434 million, a decrease of $8,756 million
from December31, 2012 driven by the increase in discount rates,
primarily in the U.S. At year end, the company’s qualified defined
benefit plans were well funded and the cash requirements related
to these plans remain stable going forward at less than $700 mil-
lion per year through 2015. In 2013, the return on the U.S. Personal
Pension Plan assets was 7.1percent and the plan was 109percent
funded. Overall, global asset returns were 7.1percent and the quali-
fied defined benefit plans worldwide were 102percent funded.
During 2013, the company generated $17,485 million in cash
from operations, a decrease of $2,102 million compared to 2012. In
addition, the company generated $15,021 million in free cash flow,
a decrease of $3,164 million versus 2012. The company returned
$17,917 million to shareholders in 2013, with $13,859 million in gross
share repurchases and $4,058 million in dividends. In 2013 the
company repurchased approximately 73 million shares and had
approximately $14.7 billion remaining in share repurchase autho-
rization at year end.
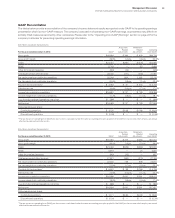
Income Taxes
The continuing operations effective tax rate for 2013 was 16.6per-
cent, a decrease of 8.0points versus the prior year, driven by the
following factors:
• A benefit resulting from the completion of the U.S. 2008–2010
tax audit, including associated reserve redeterminations
(11.1points);
• A benefit due to a more favorable geographic mix of pre-tax
income in 2013 (2.2points);
• Benefits from the retroactive impact of the 2012 American
Taxpayer Relief Act (0.7points) and an increase in research
and development credits (0.5points);
• A benefit from a tax agreement which required a reassess-
ment of certain valuation allowances on deferred tax assets
(1.4points); and,
• Benefits from the resolution of certain non-U.S. tax audits
(0.7points) and newly enacted U.S. state tax legislation
(0.6points); partially offset by
• Tax charges related to certain intercompany payments
made by foreign subsidiaries and the intercompany licensing
of certain IP (8.8points); and
• The year-over-year impact of the 2012 benefit related to a tax
restructuring in Latin America (0.7points).
The operating (non-GAAP) effective tax rate was 17.0percent, a
decrease of 7.3points versus 2012 principally driven by the same
factors described above.
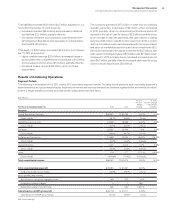
Results of Discontinued Operations
Loss from discontinued operations, net of tax was $398 million in
2013 compared to $395 million in 2012. The discontinued opera-
tions effective tax rate in 2013 was 44.8percent compared to
38.1percent in 2012.