IBM 2014 Annual Report Download - page 57
Download and view the complete annual report
Please find page 57 of the 2014 IBM annual report below. You can navigate through the pages in the report by either clicking on the pages listed below, or by using the keyword search tool below to find specific information within the annual report.-
 1
1 -
2
-
3
-
4
-
5
-
6
-
7
-
8
-
9
-
10
-
11
-
12
-
13
-
14
-
15
-
16
-
17
-
18
-
19
-
20
-
21
-
22
-
23
-
24
-
25
-
26
-
27
-
28
-
29
-
30
-
31
-
32
-
33
-
34
-
35
-
36
-
37
-
38
-
39
-
40
-
41
-
42
-
43
-
44
-
45
-
46
-
 47
47 -
 48
48 -
 49
49 -
 50
50 -
 51
51 -
 52
52 -
 53
53 -
 54
54 -
 55
55 -
 56
56 -
 57
57 -
 58
58 -
 59
59 -
 60
60 -
 61
61 -
 62
62 -
 63
63 -
 64
64 -
 65
65 -
 66
66 -
 67
67 -
68
-
69
-
70
-
71
-
72
-
73
-
74
-
75
-
76
-
77
-
78
-
79
-
80
-
81
-
82
-
83
-
84
-
85
-
86
-
87
-
88
-
89
-
90
-
91
-
92
-
93
-
94
-
95
-
96
-
97
-
98
-
99
-
100
-
101
-
102
-
103
-
104
-
105
-
106
-
107
-
108
-
109
-
110
-
111
-
112
-
113
-
114
-
115
-
116
-
117
-
118
-
119
-
120
-
121
-
122
-
123
-
124
-
125
-
126
-
127
-
128
-
129
-
130
-
131
-
132
-
133
-
134
-
135
-
136
-
137
-
138
-
139
-
140
-
141
-
142
-
143
-
144
-
145
-
146
-
147
-
148
-
149
-
150
-
151
-
152
-
153
-
154
-
155
-
156
-
157
-
158
 |
 |
56 Management Discussion
International Business Machines Corporation and Subsidiary Companies
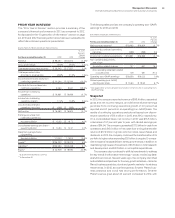
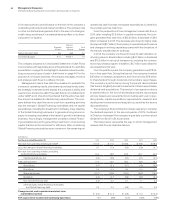
($ in millions)
For the year ended December 31: 2013 2012
Yr.-to-Yr.
Percent
Change
Yr.-to-Yr.
Percent Change
Adjusted for
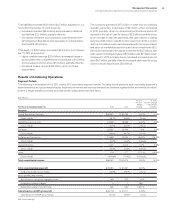
Currency
Global Services external revenue $56,947 $58,802 (3.2)% (0.2)%
Global Technology Services $38,551 $40,236 (4.2)% (1.4)%
Outsourcing 22,060 23,344 (5.5) (2.7)
Integrated Technology Services 9,380 9,550 (1.8) 1.0
Maintenance 7,111 7,343 (3.1) (0.7)
Global Business Services $18,396 $18,566 (0.9)% 2.6%
Outsourcing 4,097 4,209 (2.6) 1.5
Consulting and Systems Integration 14,298 14,358 (0.4) 2.9
Global Technology Services revenue of $38,551 million in 2013
decreased 4.2percent (1percent adjusted for currency) year to
year. From a geographic perspective, revenue declined in North
America and Europe, partially offset by growth in Japan, adjusted
for currency. GTS Outsourcing revenue decreased 5.5percent
(3percent adjusted for currency) in 2013. Revenue performance
was impacted by a decline in revenue from sales into existing
base accounts and by the work done to improve the profitability
of restructured low margin contracts. GTS Outsourcing had dou-
ble-digit signings growth in 2013 and started to realize the benefit
from several of the large transformational contract signings in its
fourth-quarter 2013 revenue. ITS revenue decreased 1.8percent
as reported, but increased 1percent adjusted for currency in 2013
compared to 2012. The company continued to shift the ITS busi-
ness toward higher value managed services such as business
continuity, security and cloud. Within the cloud offerings, SoftLayer
contributed 2points of revenue growth to the ITS performance in
2013, and a half-point to total GTS revenue for the year. In January
2014, the company announced plans to invest over $1.2 billion to
double its SoftLayer centers, and with 40 cloud datacenters in
15 countries, the company will have cloud centers in every major
geography and key financial center.
Global Business Services revenue of $18,396 million decreased
0.9percent as reported, but increased 3percent at constant cur-
rency in 2013 with growth in both GBS Outsourcing and C&SI,
adjusted for currency. GBS revenue increased 0.5percent (4per-
cent at constant currency) in the second half of the year. On a
geographic basis, revenue growth at constant currency was led
by North America, Japan and the growth markets, while Europe
was flat year to year. GBS delivered double-digit growth in each
of the strategic growth initiatives of business analytics, Smarter
Planet and cloud. The company has been investing to build
capabilities in these key areas and at year-end 2013 had nearly
20,000 resources in GBS focused on the growing Digital Front
Office opportunity. Application Outsourcing revenue decreased
2.6percent as reported, but increased 2percent adjusted for
currency. C&SI revenue decreased 0.4percent as reported, but
increased 3percent adjusted for currency. Both lines of business
had constant currency revenue growth year to year in the growth
markets. In 2013, the GBS backlog grew for the fifth consecutive
year at constant currency led by the major markets.
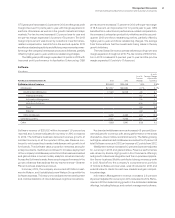
($ in millions)
For the year ended December 31: 2013 2012
Yr.-to-Yr.
Percent/
Margin
Change
Global Services
Global Technology Services
External gross profit $14,691 $14,740 (0.3)%
External gross profit margin 38.1% 36.6% 1.5 pts.
Pre-tax income $ 6,983 $ 6,961 0.3%
Pre-tax margin 17.6% 16.8%0.8 pts.
Global Business Services
External gross profit $ 5,676 $ 5,564 2.0%
External gross profit margin 30.9% 30.0%0.9 pts.
Pre-tax income $ 3,214 $ 2,983 7.7%
Pre-tax margin 16.8%15.5%1.3 pts.
areas. Total outsourcing revenue of $26,157 million decreased
5.1percent (2percent adjusted for currency) and total transactional
revenue of $23,678 million decreased 1.0percent as reported, but
increased 2percent adjusted for currency year to year. The esti-
mated Global Services backlog was $143 billion at December31,
2013, an increase of 1.8percent (5percent adjusted for currency)
versus the December31, 2012 balance.
Global Services
In 2013, the Global Services segments delivered $56,947 million
of revenue, grew pre-tax income 2.5percent and expanded pre-
tax margin 1.0points. GBS returned to revenue growth in 2013, at
constant currency, leveraging the investments made in the Digital
Front Office practices. GTS revenue performance improved during
the second half of 2013. Global Services had good performance in
the key growth initiatives of Smarter Planet, business analytics and
cloud, and continued to invest to expand its capabilities in these