IBM 2014 Annual Report Download - page 66
Download and view the complete annual report
Please find page 66 of the 2014 IBM annual report below. You can navigate through the pages in the report by either clicking on the pages listed below, or by using the keyword search tool below to find specific information within the annual report.-
 1
1 -
2
-
3
-
4
-
5
-
6
-
7
-
8
-
9
-
10
-
11
-
12
-
13
-
14
-
15
-
16
-
17
-
18
-
19
-
20
-
21
-
22
-
23
-
24
-
25
-
26
-
27
-
28
-
29
-
30
-
31
-
32
-
33
-
34
-
35
-
36
-
37
-
38
-
39
-
40
-
41
-
42
-
43
-
44
-
45
-
46
-
47
-
48
-
49
-
50
-
51
-
52
-
53
-
54
-
55
-
 56
56 -
 57
57 -
 58
58 -
 59
59 -
 60
60 -
 61
61 -
 62
62 -
 63
63 -
 64
64 -
 65
65 -
 66
66 -
 67
67 -
 68
68 -
 69
69 -
 70
70 -
 71
71 -
 72
72 -
 73
73 -
 74
74 -
 75
75 -
 76
76 -
77
-
78
-
79
-
80
-
81
-
82
-
83
-
84
-
85
-
86
-
87
-
88
-
89
-
90
-
91
-
92
-
93
-
94
-
95
-
96
-
97
-
98
-
99
-
100
-
101
-
102
-
103
-
104
-
105
-
106
-
107
-
108
-
109
-
110
-
111
-
112
-
113
-
114
-
115
-
116
-
117
-
118
-
119
-
120
-
121
-
122
-
123
-
124
-
125
-
126
-
127
-
128
-
129
-
130
-
131
-
132
-
133
-
134
-
135
-
136
-
137
-
138
-
139
-
140
-
141
-
142
-
143
-
144
-
145
-
146
-
147
-
148
-
149
-
150
-
151
-
152
-
153
-
154
-
155
-
156
-
157
-
158
 |
 |

65
Management Discussion
International Business Machines Corporation and Subsidiary Companies
trajectory that requires significant growth within its earnings
expectations. As indicated above, the company has established
a range for its earnings expectation for 2015. The performance
of the Software business is key to this range—the low end of the
expected range assumes no improvement in trajectory for the
Software business, while the high end of the range assumes a
stabilization of the Software business relative to 2014.
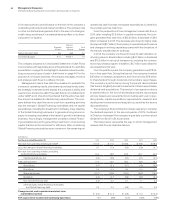
The company’s free cash flow performance in 2014 compared
to the prior year was impacted by operational performance, an
increase in cash tax payments and working capital impacts related
to the industry standard server divestiture. Looking forward to
2015, at the level of expected profit, the company expects free
cash flow to be relatively flat compared to 2014. From a free
cash flow to income from continuing operations perspective,
free cash flow realization was 79percent as reported in 2014
and is expected to improve to the mid-80’s percent level in 2015.
In 2014, realization was impacted by higher cash tax payments
and the gain associated with the industry standard server dives-
titure. While these impacts are not expected to be as significant
in 2015, the company expects to increase capital investments by
approximately $0.5 billion in 2015 driven by the continued buildout
of the SoftLayer cloud platform. In addition, the company expects
impacts to realization in 2015 from the timing of payments related
to workforce rebalancing actions taken in 2014 and working capital
impacts related to the industry standard server divestiture. Over-
all, with a year-to-year profit decline expected, and the impacts
described from capital investments, workforce rebalancing and
working capital, all this results in the expectation that free cash
flow will be essentially flat year to year.
The company expects, in the normal course of business, that
its effective tax rate and operating (non-GAAP) tax rate will be
approximately 20percent in 2015. The rate will change year to year
based on nonrecurring events, such as the settlement of income
tax audits and changes in tax laws, as well as recurring factors
including the geographic mix of income before taxes, the timing
and amount of foreign dividend repatriation, state and local taxes
and the effects of various global income tax strategies.
The company expects 2015 pre-tax retirement-related plan
cost to be approximately $2.5 billion, an increase of approximately
$500 million compared to 2014. This estimate reflects current
pension plan assumptions at December31, 2014. Within total
retirement-related plan cost, operating retirement-related plan
cost is expected to be approximately $1.6 billion, a decrease of
approximately $100 million versus 2014. Non-operating retirement-
related plan cost is expected to be approximately $900 million, an
increase of approximately $600 million compared to 2014, driven
by increased recognized actuarial losses. Cash disbursements for
all retirement-related plans are expected to be approximately $2.7
billion in 2015, an increase of approximately $100 million compared
to 2014. See noteS, “Retirement-Related Benefits,” on pages 131
to 145 for additional information.
For a discussion of new accounting standards that the com-
pany will adopt in future periods, please see noteB, “Accounting
Changes” beginning on page 96.
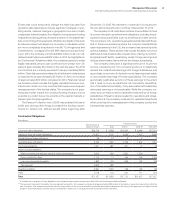
Liquidity and Capital Resources
The company has consistently generated strong cash flow from
operations, providing a source of funds ranging between $16.9
billion and $19.8 billion per year over the past five years. The com-
pany provides for additional liquidity through several sources:
maintaining an adequate cash balance, access to global funding
sources, a committed global credit facility and other committed
and uncommitted lines of credit worldwide. The following table
provides a summary of the major sources of liquidity for the years
ended December31, 2010 through 2014.
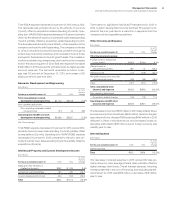
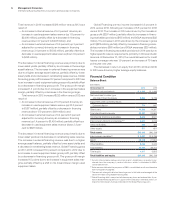
Cash Flow and Liquidity Trends
($ in billions)
2014 2013 2012 2011 2010
Net cash from
operating activities $16.9 $17.5 $19.6 $19.8 $19.5
Cash and short-term
marketable securities $ 8.5 $11.1 $11.1 $11.9 $11.7
Committed global
credit facility $10.0 $10.0 $10.0 $10.0 $10.0
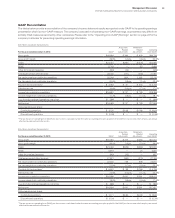
The major rating agencies’ ratings on the company’s debt securi-
ties at December31, 2014 appear in the following table and remain
unchanged from December31, 2013. The company’s indenture
governing its debt securities and its various credit facilities each
contain significant covenants which obligate the company to
promptly pay principal and interest, limit the aggregate amount
of secured indebtedness and sale and leaseback transactions to
10percent of the company’s consolidated net tangible assets,
and restrict the company’s ability to merge or consolidate unless
certain conditions are met. The credit facilities also include a cov-
enant on the company’s consolidated net interest expense ratio,
which cannot be less than 2.20 to 1.0, as well as a cross default
provision with respect to other defaulted indebtedness of at least
$500 million.
The company is in compliance with all of its significant debt
covenants and provides periodic certification to its lenders. The
failure to comply with its debt covenants could constitute an event
of default with respect to the debt to which such provisions apply.
If certain events of default were to occur, the principal and interest
on the debt to which such event of default applied would become
immediately due and payable.
The company does not have “ratings trigger” provisions in its
debt covenants or documentation, which would allow the holders
to declare an event of default and seek to accelerate payments
thereunder in the event of a change in credit rating. The com-
pany’s contractual agreements governing derivative instruments
contain standard market clauses which can trigger the termination
of the agreement if the company’s credit rating were to fall below
investment grade. At December31, 2014, the fair value of those
instruments that were in a liability position was $196 million, before
any applicable netting, and this position is subject to fluctuations