IBM 2014 Annual Report Download - page 23
Download and view the complete annual report
Please find page 23 of the 2014 IBM annual report below. You can navigate through the pages in the report by either clicking on the pages listed below, or by using the keyword search tool below to find specific information within the annual report.-
 1
1 -
2
-
3
-
4
-
5
-
6
-
7
-
8
-
9
-
10
-
11
-
12
-
 13
13 -
 14
14 -
 15
15 -
 16
16 -
 17
17 -
 18
18 -
 19
19 -
 20
20 -
 21
21 -
 22
22 -
 23
23 -
 24
24 -
 25
25 -
 26
26 -
 27
27 -
 28
28 -
 29
29 -
 30
30 -
 31
31 -
 32
32 -
 33
33 -
34
-
35
-
36
-
37
-
38
-
39
-
40
-
41
-
42
-
43
-
44
-
45
-
46
-
47
-
48
-
49
-
50
-
51
-
52
-
53
-
54
-
55
-
56
-
57
-
58
-
59
-
60
-
61
-
62
-
63
-
64
-
65
-
66
-
67
-
68
-
69
-
70
-
71
-
72
-
73
-
74
-
75
-
76
-
77
-
78
-
79
-
80
-
81
-
82
-
83
-
84
-
85
-
86
-
87
-
88
-
89
-
90
-
91
-
92
-
93
-
94
-
95
-
96
-
97
-
98
-
99
-
100
-
101
-
102
-
103
-
104
-
105
-
106
-
107
-
108
-
109
-
110
-
111
-
112
-
113
-
114
-
115
-
116
-
117
-
118
-
119
-
120
-
121
-
122
-
123
-
124
-
125
-
126
-
127
-
128
-
129
-
130
-
131
-
132
-
133
-
134
-
135
-
136
-
137
-
138
-
139
-
140
-
141
-
142
-
143
-
144
-
145
-
146
-
147
-
148
-
149
-
150
-
151
-
152
-
153
-
154
-
155
-
156
-
157
-
158
 |
 |
22 Management Discussion
International Business Machines Corporation and Subsidiary Companies
OVERVIEW
The financial section of the International Business Machines Cor-
por ation (IBM or the company) 2014 Annual Report includes the
Management Discussion, the Consolidated Financial State ments
and the Notes to Consolidated Financial State ments. This Over-
view is designed to provide the reader with some perspective
regarding the information contained in the financial section.
Organization of Information
• The Management Discussion is designed to provide
readers with an overview of the business and a narrative on
the company’s financial results and certain factors that
may affect its future prospects from the perspective of the
company’s management. The “Management Discussion
Snap shot,” beginning on page 23, presents an overview of
the key performance drivers in 2014.
• Beginning with the “Year in Review” on page 33, the
Manage ment Discussion contains the results of operations
for each reportable segment of the business and a discus-
sion of the company’s financial position and cash flows.
Other key sections within the Management Discussion
include: “Looking Forward” on page 64, and “Liquidity and
Capital Resources” on page 65.
• Global Financing is a reportable segment that is measured
as a stand-alone entity. A separate “Global Financing” section
is included in the Management Discussion beginning on
page 73.
• The Consolidated Financial Statements are presented on
pages 80 through 85. These statements provide an overview
of the company’s income and cash flow performance and
its financial position.
• The Notes follow the Consolidated Financial Statements.
Among other items, the Notes contain the company’s
accounting policies (pages 86 through 96), acquisitions and
divestitures (pages 97 through 102), detailed information on
specific items within the financial statements, certain contin-
gencies and commitments (pages 122 to 124) and
retirement-related plans information (pages 131 to 145).
• The Consolidated Financial Statements and the Notes have
been prepared in accordance with accounting principles
generally accepted in the United States (GAAP).
• In October 2014, the company announced a definitive agree-
ment to divest its Microelectronics business. The assets and
liabilities of the Microelectronics business are reported as
held for sale at December31, 2014. The operating results of
the Microelectronics business are reported as discontinued
operations. Prior periods have been reclassified to conform
to this presentation in the Management Discussion, the
Consolidated Financial Statements and the Notes, where
applicable, to allow for a meaningful comparison of continu-
ing operations.
• The references to “adjusted for currency” or “at constant
currency” in the Management Discussion do not include
operational impacts that could result from fluctuations in
foreign currency rates. Certain financial results are adjusted
based on a simple mathematical model that translates current
period results in local currency using the comparable prior
year period’s currency conversion rate. This approach is used
for countries where the functional currency is the local country
currency. This information is provided so that certain finan-
cial results can be viewed without the impact of fluctuations
in foreign currency rates, thereby facilitating period- to-period
comparisons of business performance. See “Currency Rate
Fluctuations” on page 71 for additional information.
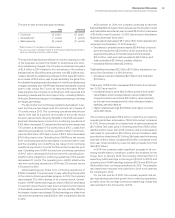
• Within the financial statements and tables in this Annual
Report, certain columns and rows may not add due to
the use of rounded numbers for disclosure purposes.
Percentages reported are calculated from the underlying
whole-dollar numbers.
Operating (non-GAAP) Earnings
In an effort to provide better transparency into the operational
results of the business, the company separates business results
into operating and non-operating categories. Operating earn-
ings from continuing operations is a non-GAAP measure that
excludes the effects of certain acquisition-related charges, retire
-
ment-related costs, discontinued operations and their related tax
impacts. For acquisitions, operating earnings exclude the amor
-
tization of purchased intangible assets and acquisition-related
charges such as in-process research and development, transac-
tion costs, applicable restructuring and related expenses and tax
charges related to acquisition integration. For retirement-related
costs, the company characterizes certain items as operating and
others as non-operating. The company includes defined benefit
plan and nonpension postretirement benefit plan service cost,
amortization of prior service cost and the cost of defined contribu-
tion plans in operating earnings. Non-operating retirement-related
cost includes defined benefit plan and nonpension postretirement
benefit plan interest cost, expected return on plan assets, amor-
tized actuarial gains/losses, the impacts of any plan curtailments/
settlements and multi-employer plan costs, pension insolvency
costs and other costs. Non-operating retirement-related costs are
primarily related to changes in pension plan assets and liabilities
which are tied to financial market performance and the company
considers these costs to be outside the operational performance
of the business.
Overall, the company believes that providing investors with a
view of operating earnings as described above provides increased
transparency and clarity into both the operational results of the
business and the performance of the company’s pension plans;
improves visibility to management decisions and their impacts on
operational performance; enables better comparison to peer com-
panies; and allows the company to provide a long-term strategic
view of the business going forward. The company’s reportable
segment financial results reflect operating earnings from continu-
ing operations, consistent with the company’s management and
measurement system.