IBM 2014 Annual Report Download - page 126
Download and view the complete annual report
Please find page 126 of the 2014 IBM annual report below. You can navigate through the pages in the report by either clicking on the pages listed below, or by using the keyword search tool below to find specific information within the annual report.-
 1
1 -
2
-
3
-
4
-
5
-
6
-
7
-
8
-
9
-
10
-
11
-
12
-
13
-
14
-
15
-
16
-
17
-
18
-
19
-
20
-
21
-
22
-
23
-
24
-
25
-
26
-
27
-
28
-
29
-
30
-
31
-
32
-
33
-
34
-
35
-
36
-
37
-
38
-
39
-
40
-
41
-
42
-
43
-
44
-
45
-
46
-
47
-
48
-
49
-
50
-
51
-
52
-
53
-
54
-
55
-
56
-
57
-
58
-
59
-
60
-
61
-
62
-
63
-
64
-
65
-
66
-
67
-
68
-
69
-
70
-
71
-
72
-
73
-
74
-
75
-
76
-
77
-
78
-
79
-
80
-
81
-
82
-
83
-
84
-
85
-
86
-
87
-
88
-
89
-
90
-
91
-
92
-
93
-
94
-
95
-
96
-
97
-
98
-
99
-
100
-
101
-
102
-
103
-
104
-
105
-
106
-
107
-
108
-
109
-
110
-
111
-
112
-
113
-
114
-
115
-
 116
116 -
 117
117 -
 118
118 -
 119
119 -
 120
120 -
 121
121 -
 122
122 -
 123
123 -
 124
124 -
 125
125 -
 126
126 -
 127
127 -
 128
128 -
 129
129 -
 130
130 -
 131
131 -
 132
132 -
 133
133 -
 134
134 -
 135
135 -
 136
136 -
137
-
138
-
139
-
140
-
141
-
142
-
143
-
144
-
145
-
146
-
147
-
148
-
149
-
150
-
151
-
152
-
153
-
154
-
155
-
156
-
157
-
158
 |
 |

Notes to Consolidated Financial Statements
International Business Machines Corporation and Subsidiary Companies
125
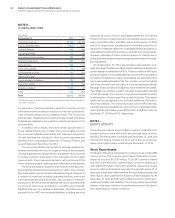
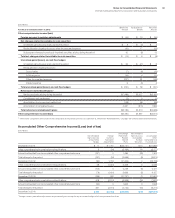
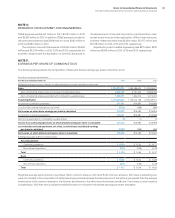
The components of the income from continuing operations provi-
sion for income taxes by taxing jurisdiction are as follows:
($ in millions)
For the year ended December 31: 2014 2013*2012*
U.S. federal
Current $ 1,134 $1,694 $1,556
Deferred 105 (708) 415
1,239 986 1,971
U.S. state and local
Current 541 277 168
Deferred (105) (330) 291
436 (53) 459
Non-U.S.
Current 2,825 3,067 3,006
Deferred (266) (637) 105
2,559 2,430 3,111
Total continuing operations provision
for income taxes 4,234 3,363 5,541
Discontinued operations provision
for income taxes (1,617) (322)(243)
Provision for social security,
real estate, personal property
and other taxes 4,068 4,198 4,331
Total taxes included in net income $ 6,685 $7,238 $9,629
* Reclassified to reflect discontinued operations presentation.
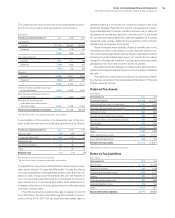
A reconciliation of the statutory U.S. federal tax rate to the com-
pany’s effective tax rate from continuing operations is as follows:
For the year ended December 31: 2014 2013*2012*
Statutory rate 35% 35% 35%
Foreign tax differential (14) (13) (10)
State and local 10 1
Domestic incentives (2) (3) (1)
Other 1(2) 0
Effective rate 21% 17% 25%
Percentages rounded for disclosure purposes.
* Reclassified to reflect discontinued operations presentation.
The significant components reflected within the tax rate reconcili-
ation above labeled “Foreign tax differential” include the effects
of foreign subsidiaries’ earnings taxed at rates other than the U.S.
statutory rate, foreign export incentives, the U.S. tax impacts of
non-U.S. earnings repatriation and any net impacts of intercom-
pany transactions. These items also reflect audit settlements or
changes in the amount of unrecognized tax benefits associated
with each of these items.
The 2014 continuing operations tax rate increased 4.6points
from 2013 due to the lack of the following 2013 benefits: the com-
pletion of the 2008–2010 U.S. tax audit and associated reserve
redeterminations (11.1points), the retroactive impact of the 2012
American Taxpayer Relief Act (0.7points), a tax agreement requir-
ing a reassessment of certain valuation allowances on deferred
tax assets (1.4points), the resolution of certain non-U.S. tax audits
(0.7points) and newly enacted U.S. state tax legislation (0.6points),
as well as a tax charge related to the divestiture of the industry
standard server business (0.9points).
These increases were partially offset by benefits due to the
following: the year-to-year reduction in tax charges related to cer-
tain intercompany payments made by foreign subsidiaries and the
licensing of certain intellectual property (3.7points), the increased
utilization of foreign tax credits (4.7points), and a more favorable
geographic mix of pre-tax income in 2014 (2.5points).
The effect of tax law changes on deferred tax assets and lia-
bilities did not have a material impact on the company’s effective
tax rate.
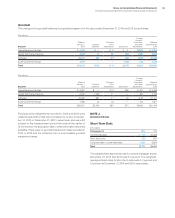
The significant components of deferred tax assets and liabili-
ties that are recorded in the Consolidated Statement of Financial
Position were as follows:
Deferred Tax Assets
($ in millions)
At December 31: 2014 2013*
Retirement benefits $ 4,795 $ 3,704
Share-based and other compensation 1,328 1,262
Domestic tax loss/credit carryforwards 858 982
Deferred income 957 964
Foreign tax loss/credit carryforwards 686 651
Bad debt, inventory and warranty reserves 529 592
Depreciation 329 382
Accruals 1,176 322
Other 1,306 1,452
Gross deferred tax assets 11,964 10,311
Less: valuation allowance 646 734
Net deferred tax assets $11,318 $ 9,577
* Reclassified to conform with 2014 presentation.
Deferred Tax Liabilities
($ in millions)
At December 31: 2014 2013
Depreciation $ 487 $1,346
Retirement benefits 205 1,219
Goodwill and intangible assets 1,263 1,173
Leases 912 1,119
Software development costs 421 558
Deferred transition costs 374 424
Other 1,111 841
Gross deferred tax liabilities $4,773 $6,680