IBM 2014 Annual Report Download - page 46
Download and view the complete annual report
Please find page 46 of the 2014 IBM annual report below. You can navigate through the pages in the report by either clicking on the pages listed below, or by using the keyword search tool below to find specific information within the annual report.-
 1
1 -
2
-
3
-
4
-
5
-
6
-
7
-
8
-
9
-
10
-
11
-
12
-
13
-
14
-
15
-
16
-
17
-
18
-
19
-
20
-
21
-
22
-
23
-
24
-
25
-
26
-
27
-
28
-
29
-
30
-
31
-
32
-
33
-
34
-
35
-
 36
36 -
 37
37 -
 38
38 -
 39
39 -
 40
40 -
 41
41 -
 42
42 -
 43
43 -
 44
44 -
 45
45 -
 46
46 -
 47
47 -
 48
48 -
 49
49 -
 50
50 -
 51
51 -
 52
52 -
 53
53 -
 54
54 -
 55
55 -
 56
56 -
57
-
58
-
59
-
60
-
61
-
62
-
63
-
64
-
65
-
66
-
67
-
68
-
69
-
70
-
71
-
72
-
73
-
74
-
75
-
76
-
77
-
78
-
79
-
80
-
81
-
82
-
83
-
84
-
85
-
86
-
87
-
88
-
89
-
90
-
91
-
92
-
93
-
94
-
95
-
96
-
97
-
98
-
99
-
100
-
101
-
102
-
103
-
104
-
105
-
106
-
107
-
108
-
109
-
110
-
111
-
112
-
113
-
114
-
115
-
116
-
117
-
118
-
119
-
120
-
121
-
122
-
123
-
124
-
125
-
126
-
127
-
128
-
129
-
130
-
131
-
132
-
133
-
134
-
135
-
136
-
137
-
138
-
139
-
140
-
141
-
142
-
143
-
144
-
145
-
146
-
147
-
148
-
149
-
150
-
151
-
152
-
153
-
154
-
155
-
156
-
157
-
158
 |
 |

45
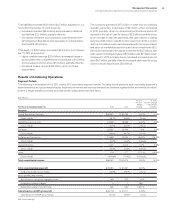
Management Discussion
International Business Machines Corporation and Subsidiary Companies
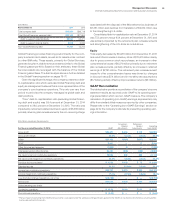
($ in millions except per share amounts)
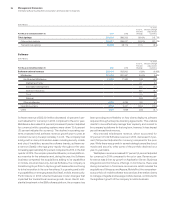
For the year ended December 31, 2014: GAAP
Acquisition-
Related
Adjustments
Retirement-
Related
Adjustments
Operating
(non-GAAP)
Gross profit $46,407 $ 416 $ 173 $46,996
Gross profit margin 50.0% 0.4 pts. 0.2 pts. 50.6%
SG&A $23,180 $(385) $(257) $22,537
RD&E 5,437 — 77 5,514
Other (income) and expense (1,938) (1) — (1,939)
Total expense and other (income) 26,421 (386) (180) 25,855
Pre-tax income from continuing operations 19,986 803 353 21,142
Pre-tax income margin from continuing operations 21.5% 0.9 pts. 0.4 pts. 22.8%
Provision for income taxes* $ 4,234 $ 133 $ 73 $ 4,440
Effective tax rate 21.2% (0.2) pts. 0.0 pts. 21.0%
Income from continuing operations $15,751 $ 670 $ 280 $16,702
Income margin from continuing operations 17.0% 0.7 pts. 0.3 pts. 18.0%
Loss from discontinued operations, net of tax $ (3,729) — $ — $ (3,729)
Net income $12,022 $ 670 $ 280 $12,973
Diluted earnings per share:
Continuing operations $ 15.59 $0.66 $0.28 $ 16.53
Discontinued operations $ (3.69) $ — $ — $ (3.69)
* The tax impact on operating (non-GAAP) pre-tax income is calculated under the same accounting principles applied to the GAAP pre-tax income which employs an annual effec-
tive tax rate method to the results.
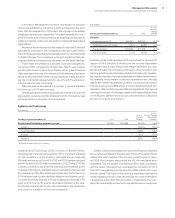
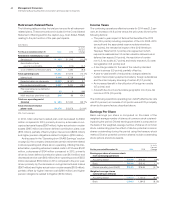
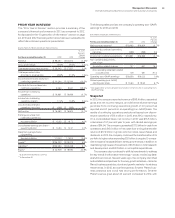
($ in millions)
At December 31: 2014 2013
Total company debt $40,804 $39,718
Total Global Financing segment debt $29,103 $27,504
Debt to support external clients 25,531 24,471
Debt to support internal clients 3,572 3,033
Non-Global Financing debt 11,701 12,214
Global Financing provides financing predominantly for the com-
pany’s external client assets, as well as for assets under contract
by other IBM units. These assets, primarily for Global Services,
generate long-term, stable revenue streams similar to the Global
Financing asset portfolio. Based on their attributes, these Global
Services assets are leveraged with the balance of the Global
Financing asset base. The debt analysis above is further detailed
in the Global Financing section on pages 76–77.
Given the significant leverage, the company presents a debt-
to-capitalization ratio which excludes Global Financing debt and
equity as management believes this is more representative of the
company’s core business operations. This ratio can vary from
period to period as the company manages its global cash and
debt positions.
“Core” debt-to-capitalization ratio (excluding Global Financ
-
ing debt and equity) was 59.4percent at December31, 2014
compared to 39.0percent at December31, 2013. The ratio was
impacted by retirement-related declines in equity of $6,366 million
primarily driven by plan remeasurements, the non-recurring charge
associated with the disposal of the Microelectronics business of
$3,381 million and declines from translation of $2,074 million due
to the strengthening U.S. dollar.
Consolidated debt-to-capitalization ratio at December31, 2014
was 77.3percent versus 63.4percent at December31, 2013 and
was similarly impacted by the retirement plan remeasurements
and strengthening of the U.S. dollar as noted above.
Equity
Total equity decreased by $10,916 million from December31, 2013
as a result of an increase in treasury stock of $13,474 million mainly
due to gross common stock repurchases, an increase in other
comprehensive losses of $6,274 million primarily due to retirement
plan remeasurements, partially offset by an increase in retained
earnings of $7,751 million. The retirement plan remeasurement
impact to other comprehensive losses was driven by: changes
in discount rates ($7.4 billion) and in mortality rate assumptions
($1.7 billion), partially offset by improved asset returns ($3.1 billion).
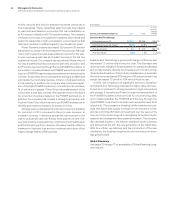
GAAP Reconciliation
The tables below provide a reconciliation of the company’s income
statement results as reported under GAAP to its operating earn-
ings presentation which is a non-GAAP measure. The company’s
calculation of operating (non-GAAP) earnings, as presented, may
differ from similarly titled measures reported by other companies.
Please refer to the “Operating (non-GAAP) Earnings” section on
page 22 for the company’s rationale for presenting operating earn-
ings information.