IBM 2014 Annual Report Download - page 115
Download and view the complete annual report
Please find page 115 of the 2014 IBM annual report below. You can navigate through the pages in the report by either clicking on the pages listed below, or by using the keyword search tool below to find specific information within the annual report.-
 1
1 -
2
-
3
-
4
-
5
-
6
-
7
-
8
-
9
-
10
-
11
-
12
-
13
-
14
-
15
-
16
-
17
-
18
-
19
-
20
-
21
-
22
-
23
-
24
-
25
-
26
-
27
-
28
-
29
-
30
-
31
-
32
-
33
-
34
-
35
-
36
-
37
-
38
-
39
-
40
-
41
-
42
-
43
-
44
-
45
-
46
-
47
-
48
-
49
-
50
-
51
-
52
-
53
-
54
-
55
-
56
-
57
-
58
-
59
-
60
-
61
-
62
-
63
-
64
-
65
-
66
-
67
-
68
-
69
-
70
-
71
-
72
-
73
-
74
-
75
-
76
-
77
-
78
-
79
-
80
-
81
-
82
-
83
-
84
-
85
-
86
-
87
-
88
-
89
-
90
-
91
-
92
-
93
-
94
-
95
-
96
-
97
-
98
-
99
-
100
-
101
-
102
-
103
-
104
-
 105
105 -
 106
106 -
 107
107 -
 108
108 -
 109
109 -
 110
110 -
 111
111 -
 112
112 -
 113
113 -
 114
114 -
 115
115 -
 116
116 -
 117
117 -
 118
118 -
 119
119 -
 120
120 -
 121
121 -
 122
122 -
 123
123 -
 124
124 -
 125
125 -
126
-
127
-
128
-
129
-
130
-
131
-
132
-
133
-
134
-
135
-
136
-
137
-
138
-
139
-
140
-
141
-
142
-
143
-
144
-
145
-
146
-
147
-
148
-
149
-
150
-
151
-
152
-
153
-
154
-
155
-
156
-
157
-
158
 |
 |
Notes to Consolidated Financial Statements
International Business Machines Corporation and Subsidiary Companies
114
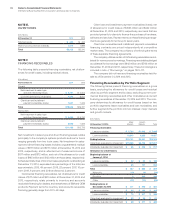
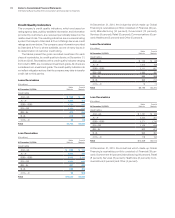
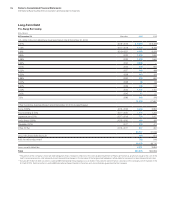
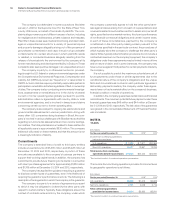
NOTE I.
INTANGIBLE ASSETS INCLUDING GOODWILL
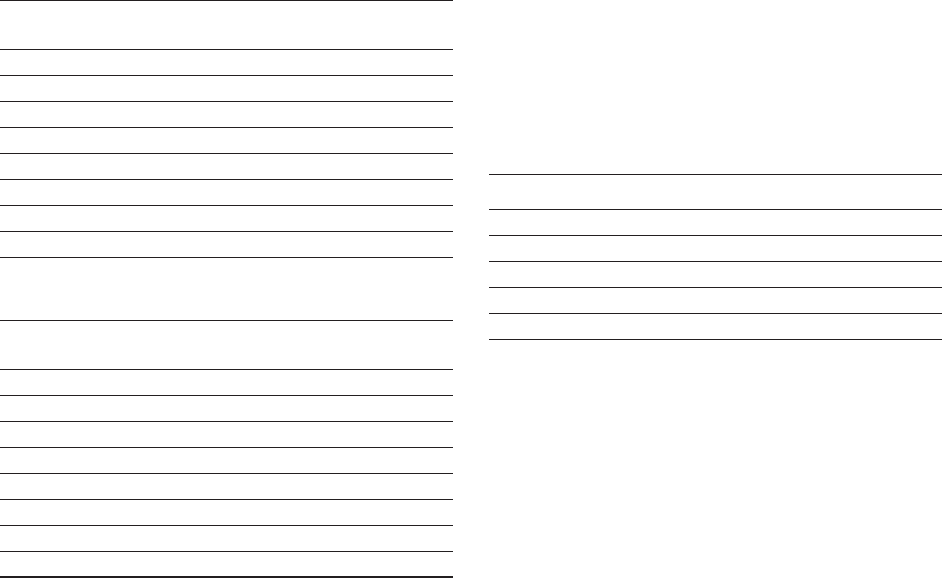
Intangible Assets
The following table details the company’s intangible asset bal-
ances by major asset class.
($ in millions)
At December 31, 2014:
Gross
Carrying
Amount
Accumulated
Amortization
Net
Carrying
Amount
Intangible asset class
Capitalized software $1,375 $ (679) $ 696
Client relationships 2,208 (1,271) 937
Completed technology 2,831 (1,533) 1,298
In-process R&D — — —
Patents/trademarks 374 (214) 161
Other* 18 (6) 12
Total $6,806 $(3,702) $3,104
($ in millions)
At December 31, 2013:
Gross
Carrying
Amount
Accumulated
Amortization
Net
Carrying
Amount
Intangible asset class
Capitalized software $1,494 $ (699) $ 794
Client relationships 2,148 (977) 1,171
Completed technology 2,910 (1,224) 1,687
In-process R&D 13 — 13
Patents/trademarks 358 (154) 204
Other* 7 (5) 2
Total $6,930 $(3,059) $3,871
* Other intangibles are primarily acquired proprietary and nonproprietary business
processes, methodologies and systems.
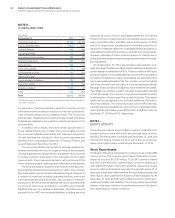
The net carrying amount of intangible assets decreased $768 mil-
lion during the year ended December31, 2014, primarily due to
amortization, partially offset by intangible asset additions resulting
from acquisitions. There was no impairment of intangible assets
recorded in 2014 and 2013. The aggregate intangible amortization
expense was $1,347 million and $1,351 million for the years ended
December31, 2014 and 2013, respectively. In addition, in 2014 and
2013, respectively, the company retired $724 million and $1,177 mil-
lion of fully amortized intangible assets, impacting both the gross
carrying amount and accumulated amortization by this amount.
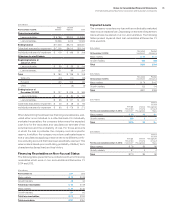
The amortization expense for each of the five succeeding years
relating to intangible assets currently recorded in the Consolidated
Statement of Financial Position is estimated to be the following at
December31, 2014:
($ in millions)
Capitalized
Software
Acquired
Intangibles Total
2015 $420 $648 $1,068
2016 211 605 816
2017 65 494 559
2018 — 349 349
2019 — 210 210