IBM 2014 Annual Report Download - page 150
Download and view the complete annual report
Please find page 150 of the 2014 IBM annual report below. You can navigate through the pages in the report by either clicking on the pages listed below, or by using the keyword search tool below to find specific information within the annual report.-
 1
1 -
2
-
3
-
4
-
5
-
6
-
7
-
8
-
9
-
10
-
11
-
12
-
13
-
14
-
15
-
16
-
17
-
18
-
19
-
20
-
21
-
22
-
23
-
24
-
25
-
26
-
27
-
28
-
29
-
30
-
31
-
32
-
33
-
34
-
35
-
36
-
37
-
38
-
39
-
40
-
41
-
42
-
43
-
44
-
45
-
46
-
47
-
48
-
49
-
50
-
51
-
52
-
53
-
54
-
55
-
56
-
57
-
58
-
59
-
60
-
61
-
62
-
63
-
64
-
65
-
66
-
67
-
68
-
69
-
70
-
71
-
72
-
73
-
74
-
75
-
76
-
77
-
78
-
79
-
80
-
81
-
82
-
83
-
84
-
85
-
86
-
87
-
88
-
89
-
90
-
91
-
92
-
93
-
94
-
95
-
96
-
97
-
98
-
99
-
100
-
101
-
102
-
103
-
104
-
105
-
106
-
107
-
108
-
109
-
110
-
111
-
112
-
113
-
114
-
115
-
116
-
117
-
118
-
119
-
120
-
121
-
122
-
123
-
124
-
125
-
126
-
127
-
128
-
129
-
130
-
131
-
132
-
133
-
134
-
135
-
136
-
137
-
138
-
139
-
 140
140 -
 141
141 -
 142
142 -
 143
143 -
 144
144 -
 145
145 -
 146
146 -
 147
147 -
 148
148 -
 149
149 -
 150
150 -
 151
151 -
 152
152 -
 153
153 -
 154
154 -
 155
155 -
 156
156 -
 157
157 -
 158
158
 |
 |

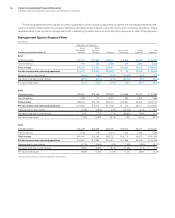
Notes to Consolidated Financial Statements
International Business Machines Corporation and Subsidiary Companies
149
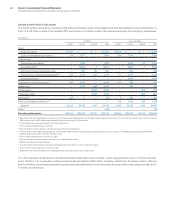
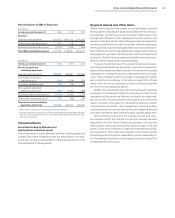
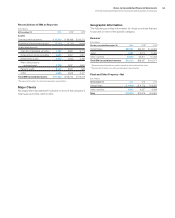
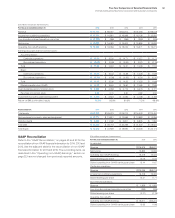
Reconciliations of IBM as Reported
($ in millions)
At December 31: 2014 2013*2012*
Assets
Total reportable segments $ 93,933 $ 98,499 $ 94,170
Elimination of internal transactions (5,193) (4,740)(4,943)
Unallocated amounts
Cash and marketable securities 7,182 9,697 9,779
Notes and accounts receivable 4,253 2,907 3,987
Deferred tax assets 6,643 4,532 5,194
Plant, other property
and equipment 2,169 4,827 4,900
Pension assets 2,160 5,551 945
Other 6,386 4,949 5,181
Total IBM consolidated assets $117,532 $126,223 $119,213
* Reclassified to reflect discontinued operations presentation.
Major Clients
No single client represented 10percent or more of the company’s
total revenue in 2014, 2013 or 2012.
Geographic Information
The following provides information for those countries that are
10percent or more of the specific category.
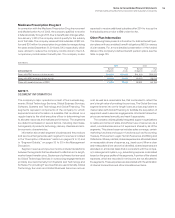
Revenue*
($ in millions)
For the year ended December 31: 2014 2013** 2012**
United States $32,021 $33,427 $ 34,653
Japan 8,382 9,070 10,696
Other countries 52,390 55,871 57,525
Total IBM consolidated revenue $92,793 $98,367 $102,874
* Revenues are attributed to countries based on the location of the client.
** Reclassified to reflect discontinued operations presentation.
Plant and Other Property—Net
($ in millions)
At December 31: 2014 2013 2012
United States $ 4,388 $ 6,723 $ 6,555
Other countries 5,690 6,257 6,299
Total $10,078 $12,979 $12,854