IBM 2014 Annual Report Download - page 138
Download and view the complete annual report
Please find page 138 of the 2014 IBM annual report below. You can navigate through the pages in the report by either clicking on the pages listed below, or by using the keyword search tool below to find specific information within the annual report.-
 1
1 -
2
-
3
-
4
-
5
-
6
-
7
-
8
-
9
-
10
-
11
-
12
-
13
-
14
-
15
-
16
-
17
-
18
-
19
-
20
-
21
-
22
-
23
-
24
-
25
-
26
-
27
-
28
-
29
-
30
-
31
-
32
-
33
-
34
-
35
-
36
-
37
-
38
-
39
-
40
-
41
-
42
-
43
-
44
-
45
-
46
-
47
-
48
-
49
-
50
-
51
-
52
-
53
-
54
-
55
-
56
-
57
-
58
-
59
-
60
-
61
-
62
-
63
-
64
-
65
-
66
-
67
-
68
-
69
-
70
-
71
-
72
-
73
-
74
-
75
-
76
-
77
-
78
-
79
-
80
-
81
-
82
-
83
-
84
-
85
-
86
-
87
-
88
-
89
-
90
-
91
-
92
-
93
-
94
-
95
-
96
-
97
-
98
-
99
-
100
-
101
-
102
-
103
-
104
-
105
-
106
-
107
-
108
-
109
-
110
-
111
-
112
-
113
-
114
-
115
-
116
-
117
-
118
-
119
-
120
-
121
-
122
-
123
-
124
-
125
-
126
-
127
-
 128
128 -
 129
129 -
 130
130 -
 131
131 -
 132
132 -
 133
133 -
 134
134 -
 135
135 -
 136
136 -
 137
137 -
 138
138 -
 139
139 -
 140
140 -
 141
141 -
 142
142 -
 143
143 -
 144
144 -
 145
145 -
 146
146 -
 147
147 -
 148
148 -
149
-
150
-
151
-
152
-
153
-
154
-
155
-
156
-
157
-
158
 |
 |

Notes to Consolidated Financial Statements
International Business Machines Corporation and Subsidiary Companies
137
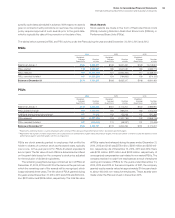
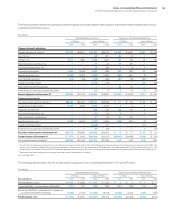
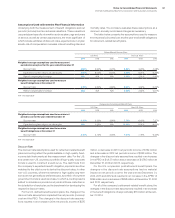
Defined Benefit Pension Plans
U.S. Plans Non-U.S. Plans
2014 2013 2012 2014 2013 2012
Weighted-average assumptions used to measure net
periodic (income)/cost for the year ended December 31
Discount rate 4.50% 3.60% 4.20% 3.32% 3.23% 4.28%
Expected long-term returns on plan assets 8.00% 8.00% 8.00% 6.08% 6.21% 6.26%
Rate of compensation increase N/A N/A N/A 2.52% 2.51% 2.43%
Weighted-average assumptions used to measure
benefit obligations at December 31
Discount rate 3.70% 4.50% 3.60% 2.34% 3.32% 3.23%
Rate of compensation increase N/A N/A N/A 2.49% 2.52% 2.51%
N/A—Not applicable
Nonpension Postretirement Benefit Plans
U.S. Plan Non-U.S. Plans
2014 2013 2012 2014 2013 2012
Weighted-average assumptions used to measure net
periodic cost for the year ended December 31
Discount rate 4.10% 3.30% 3.90% 7.78% 6.43% 7.37%
Expected long-term returns on plan assets N/A 0.35% N/A 10.22% 9.01% 9.01%
Weighted-average assumptions used to measure
benefit obligations at December 31
Discount rate 3.40% 4.10% 3.30% 7.51% 7.78% 6.43%
N/A—Not applicable
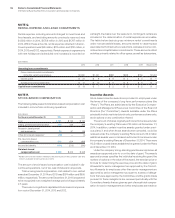
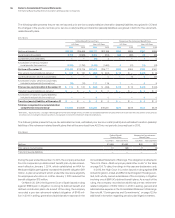
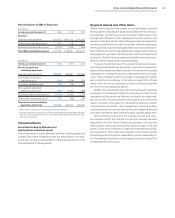
Discount Rate
The discount rate assumptions used for retirement-related benefit
plans accounting reflect the yields available on high-quality, fixed-
income debt instruments at the measurement date. For the U.S.
and certain non-U.S. countries, a portfolio of high-quality corporate
bonds is used to construct a yield curve. The cash flows from
the company’s expected benefit obligation payments are then
matched to the yield curve to derive the discount rates. In other
non-U.S. countries, where the markets for high-quality long-term
bonds are not generally as well developed, a portfolio of long-term
government bonds is used as a base, to which a credit spread is
added to simulate corporate bond yields at these maturities in
the jurisdiction of each plan, as the benchmark for developing the
respective discount rates.
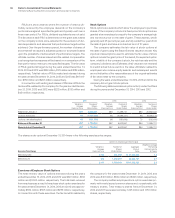
For the U.S. defined benefit pension plans, the changes in the
discount rate assumptions impacted the net periodic (income)/
cost and the PBO. The changes in the discount rate assump-
tions resulted in an increase in 2014 net periodic income of $275
million, a decrease in 2013 net periodic income of $162 million
and a decrease in 2012 net periodic income of $258 million. The
changes in the discount rate assumptions resulted in an increase
in the PBO of $4,437 million and a decrease of $4,785 million at
December 31, 2014 and 2013, respectively.
For the U.S. nonpension postretirement benefit plans, the
changes in the discount rate assumptions had no material
impact on net periodic cost for the years ended December 31,
2014, 2013 and 2012 and resulted in an increase in the APBO of
$256 million and a decrease of $298 million at December 31, 2014
and 2013, respectively.
For all of the company’s retirement-related benefit plans, the
changes in the discount rate assumptions resulted in an increase
in the benefit obligations of approximately $11.0 billion at Decem-
ber31, 2014.
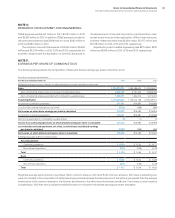
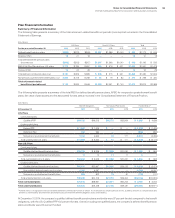
Assumptions Used to Determine Plan Financial Information
Underlying both the measurement of benefit obligations and net
periodic (income)/cost are actuarial valuations. These valuations
use participant-specific information such as salary, age and years
of service, as well as certain assumptions, the most significant of
which include estimates of discount rates, expected return on plan
assets, rate of compensation increases, interest crediting rates and
mortality rates. The company evaluates these assumptions, at a
minimum, annually, and makes changes as necessary.
The table below presents the assumptions used to measure
the net periodic (income)/cost and the year-end benefit obligations
for retirement-related benefit plans.