IBM 2014 Annual Report Download - page 37
Download and view the complete annual report
Please find page 37 of the 2014 IBM annual report below. You can navigate through the pages in the report by either clicking on the pages listed below, or by using the keyword search tool below to find specific information within the annual report.-
 1
1 -
2
-
3
-
4
-
5
-
6
-
7
-
8
-
9
-
10
-
11
-
12
-
13
-
14
-
15
-
16
-
17
-
18
-
19
-
20
-
21
-
22
-
23
-
24
-
25
-
26
-
 27
27 -
 28
28 -
 29
29 -
 30
30 -
 31
31 -
 32
32 -
 33
33 -
 34
34 -
 35
35 -
 36
36 -
 37
37 -
 38
38 -
 39
39 -
 40
40 -
 41
41 -
 42
42 -
 43
43 -
 44
44 -
 45
45 -
 46
46 -
 47
47 -
48
-
49
-
50
-
51
-
52
-
53
-
54
-
55
-
56
-
57
-
58
-
59
-
60
-
61
-
62
-
63
-
64
-
65
-
66
-
67
-
68
-
69
-
70
-
71
-
72
-
73
-
74
-
75
-
76
-
77
-
78
-
79
-
80
-
81
-
82
-
83
-
84
-
85
-
86
-
87
-
88
-
89
-
90
-
91
-
92
-
93
-
94
-
95
-
96
-
97
-
98
-
99
-
100
-
101
-
102
-
103
-
104
-
105
-
106
-
107
-
108
-
109
-
110
-
111
-
112
-
113
-
114
-
115
-
116
-
117
-
118
-
119
-
120
-
121
-
122
-
123
-
124
-
125
-
126
-
127
-
128
-
129
-
130
-
131
-
132
-
133
-
134
-
135
-
136
-
137
-
138
-
139
-
140
-
141
-
142
-
143
-
144
-
145
-
146
-
147
-
148
-
149
-
150
-
151
-
152
-
153
-
154
-
155
-
156
-
157
-
158
 |
 |

36 Management Discussion
International Business Machines Corporation and Subsidiary Companies
Software revenue of $25,434 million decreased 1.9percent (1per-
cent adjusted for currency) in 2014 compared to the prior year.
Middleware decreased 0.4percent (increased 1percent adjusted
for currency) while operating systems were down 13.4percent
(13percent adjusted for currency). The decline in operating sys-
tems impacted total software revenue growth year to year at
constant currency by approximately 1point. The company had
solid growth in many of its solution areas, including security, mobile
and cloud. In addition, across the software brands, software-as-
a-service (SaaS) offerings grew rapidly throughout the year,
increasing approximately 50percent compared to 2013. In the first
quarter of 2014, the company launched Bluemix, a cloud platform-
as-a-service for the enterprise and, during the year, the Software
business completed five acquisitions adding to its capabilities
in mobile, cloud and security. Across Software, the company is
transitioning its portfolio to capture growth areas while continuing
to drive innovation in its core franchises. It is growing and build-
ing capabilities in emerging areas like SaaS, mobile and security.
Performance in 2014 reflected business model changes that
impacted the transactional revenue growth. Given clients’ sub-
stantial investment in the IBM software platform, the company has
been providing more flexibility on how clients deploy its software
acquired through enterprise licensing agreements. This enables
clients to more effectively manage their capacity and commit to
the company’s platforms for the long term, however, it does impact
period transactional revenue.
Key branded middleware revenue, which accounted for
67percent of total Software revenue in 2014, decreased 1.3per-
cent (flat percent adjusted for currency) compared to the prior
year. While there was growth in several strategic areas like cloud,
mobile and security, other parts of the portfolio declined on a
year-to-year basis.
WebSphere revenue increased 2.7percent (4percent ad justed
for currency) in 2014 compared to the prior year. Revenue per-
formance was driven by growth in Application Server, Business
Integration and Commerce offerings. In Commerce, there was
strong momentum in Commerce-as-a-service, which includes the
acquisitions of Silverpop and Aspera. MobileFirst, the comprehen-
sive portfolio of mobile software and services that enable clients
to manage, integrate and leverage mobile devices, contributed to
the significant growth of the company’s mobile business.
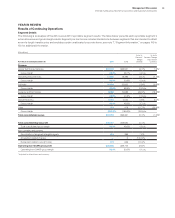
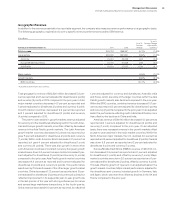
($ in millions)
For the year ended December 31: 2014 2013
Yr.-to-Yr.
Percent
Change
Yr.-to-Yr.
Percent Change
Adjusted for
Currency
Total signings $51,569 $63,203 (18.4)% (15.7)%
Outsourcing signings $26,517 $35,027 (24.3)% (21.1)%
Transactional signings 25,052 28,176 (11.1) (8.9)
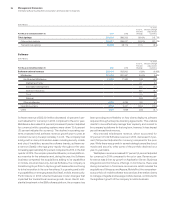
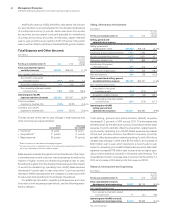
Software
($ in millions)
For the year ended December 31: 2014 2013
Yr.-to-Yr.
Percent
Change
Yr.-to-Yr.
Percent Change
Adjusted for
Currency
Software external revenue $25,434 $25,932 (1.9)% (0.9)%
Middleware $21,474 $21,557 (0.4)% 0.6%
Key Branded Middleware 17,098 17,322 (1.3) (0.2)
WebSphere Family 2.7 3.5
Information Management (4.1) (3.0)
Workforce Solutions (6.1) (5.1)
Tivoli 2.0 3.0
Rational (3.3) (1.3)
Other middleware 4,376 4,235 3.3 4.2
Operating systems 2,119 2,447 (13.4) (12.6)
Other 1,841 1,929 (4.5) (3.7)