IBM 2014 Annual Report Download - page 56
Download and view the complete annual report
Please find page 56 of the 2014 IBM annual report below. You can navigate through the pages in the report by either clicking on the pages listed below, or by using the keyword search tool below to find specific information within the annual report.-
 1
1 -
2
-
3
-
4
-
5
-
6
-
7
-
8
-
9
-
10
-
11
-
12
-
13
-
14
-
15
-
16
-
17
-
18
-
19
-
20
-
21
-
22
-
23
-
24
-
25
-
26
-
27
-
28
-
29
-
30
-
31
-
32
-
33
-
34
-
35
-
36
-
37
-
38
-
39
-
40
-
41
-
42
-
43
-
44
-
45
-
 46
46 -
 47
47 -
 48
48 -
 49
49 -
 50
50 -
 51
51 -
 52
52 -
 53
53 -
 54
54 -
 55
55 -
 56
56 -
 57
57 -
 58
58 -
 59
59 -
 60
60 -
 61
61 -
 62
62 -
 63
63 -
 64
64 -
 65
65 -
 66
66 -
67
-
68
-
69
-
70
-
71
-
72
-
73
-
74
-
75
-
76
-
77
-
78
-
79
-
80
-
81
-
82
-
83
-
84
-
85
-
86
-
87
-
88
-
89
-
90
-
91
-
92
-
93
-
94
-
95
-
96
-
97
-
98
-
99
-
100
-
101
-
102
-
103
-
104
-
105
-
106
-
107
-
108
-
109
-
110
-
111
-
112
-
113
-
114
-
115
-
116
-
117
-
118
-
119
-
120
-
121
-
122
-
123
-
124
-
125
-
126
-
127
-
128
-
129
-
130
-
131
-
132
-
133
-
134
-
135
-
136
-
137
-
138
-
139
-
140
-
141
-
142
-
143
-
144
-
145
-
146
-
147
-
148
-
149
-
150
-
151
-
152
-
153
-
154
-
155
-
156
-
157
-
158
 |
 |
55
Management Discussion
International Business Machines Corporation and Subsidiary Companies
Total liabilities increased $3.1 billion ($4.5 billion adjusted for cur-
rency) from December31, 2012 driven by:
• Increased total debt ($6.4 billion) and increases in deferred
tax liabilities ($1.3 billion); partially offset by
• Decreased retirement and nonpension postretirement ben-
efit obligations ($4.2 billion) and decreases in compensation
and benefits ($0.9 billion).
Total equity of $22.9 billion increased $3.9 billion from Decem-
ber31, 2012 as a result of:
• Higher retained earnings ($12.4 billion), decreased losses in
accumulated other comprehensive income/(loss) of $4.2 billion
and increased common stock ($1.5 billion), partially offset by
• Increased treasury stock ($14.1 billion) driven by share
repurchases.
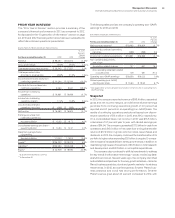
The company generated $17.5 billion in cash flow provided by
operating activities, a decrease of $2.1 billion when compared
to 2012, primarily driven by operational performance and a net
increase in the use of cash for taxes of $2.2 billion primarily driven
by an increase in cash tax payments. Net cash used in investing
activities of $7.3 billion was $1.7 billion lower than 2012, primarily
due to a decrease in cash used associated with the net purchases
and sales of marketable securities and other investments ($1.2
billion) and decreased net capital investments ($0.5 billion). Net
cash used in financing activities of $9.9 billion was $2.1 billion lower
compared to 2012, primarily due to increased proceeds from net
debt ($4.7 billion), partially offset by increased cash used for gross
common stock repurchases ($1.9 billion).
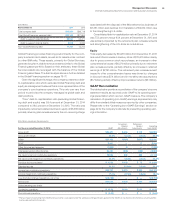
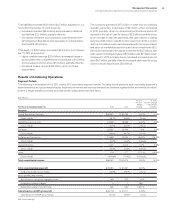
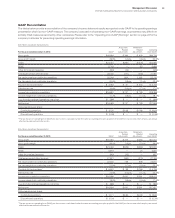
Results of Continuing Operations
Segment Details
The following is an analysis of the 2013 versus 2012 reportable segment results. The table below presents each reportable segment’s
external revenue and gross margin results. Segment pre-tax income includes transactions between segments that are intended to reflect
an arm’s-length transfer price and excludes certain unallocated corporate items.
($ in millions)
For the year ended December 31: 2013 2012
Yr.-to-Yr.
Percent/
Margin
Change
Yr.-to-Yr.
Percent Change
Adjusted for
Currency
Revenue
Global Technology Services $38,551 $ 40,236 (4.2)% (1.4)%
Gross margin 38.1% 36.6% 1.5 pts.
Global Business Services 18,396 18,566 (0.9)% 2.6%
Gross margin 30.9% 30.0% 0.9 pts.
Software 25,932 25,448 1.9% 2.9%
Gross margin 88.8% 88.7% 0.1 pts.
Systems and Technology 12,988 16,034 (19.0)% (18.2)%
Gross margin 40.8% 43.4% (2.6) pts.
Global Financing 2,022 2,013 0.4% 2.8%
Gross margin 45.6% 46.5% (0.9 ) pts.
Other 478 577 (17.1)% (16.4)%
Gross margin (195.6)% (71.6)% (124.0) pts.
Total consolidated revenue $98,367 $102,874 (4.4)% (2.3)%
Total consolidated gross profit $48,684 $ 50,361 (3.3)%
Total consolidated gross margin 49.5% 49.0% 0.5 pts.
Non-operating adjustments
Amortization of acquired intangible assets 388 375 3.5%
Acquisition-related charges 5 1 NM
Retirement-related costs/(income) 629 264 138.1%
Operating (non-GAAP) gross profit $49,706 $ 51,001 (2.5)%
Operating (non-GAAP) gross margin 50.5% 49.6% 1.0 pts.
NM—Not meaningful