IBM 2014 Annual Report Download - page 77
Download and view the complete annual report
Please find page 77 of the 2014 IBM annual report below. You can navigate through the pages in the report by either clicking on the pages listed below, or by using the keyword search tool below to find specific information within the annual report.-
 1
1 -
2
-
3
-
4
-
5
-
6
-
7
-
8
-
9
-
10
-
11
-
12
-
13
-
14
-
15
-
16
-
17
-
18
-
19
-
20
-
21
-
22
-
23
-
24
-
25
-
26
-
27
-
28
-
29
-
30
-
31
-
32
-
33
-
34
-
35
-
36
-
37
-
38
-
39
-
40
-
41
-
42
-
43
-
44
-
45
-
46
-
47
-
48
-
49
-
50
-
51
-
52
-
53
-
54
-
55
-
56
-
57
-
58
-
59
-
60
-
61
-
62
-
63
-
64
-
65
-
66
-
 67
67 -
 68
68 -
 69
69 -
 70
70 -
 71
71 -
 72
72 -
 73
73 -
 74
74 -
 75
75 -
 76
76 -
 77
77 -
 78
78 -
 79
79 -
 80
80 -
 81
81 -
 82
82 -
 83
83 -
 84
84 -
 85
85 -
 86
86 -
 87
87 -
88
-
89
-
90
-
91
-
92
-
93
-
94
-
95
-
96
-
97
-
98
-
99
-
100
-
101
-
102
-
103
-
104
-
105
-
106
-
107
-
108
-
109
-
110
-
111
-
112
-
113
-
114
-
115
-
116
-
117
-
118
-
119
-
120
-
121
-
122
-
123
-
124
-
125
-
126
-
127
-
128
-
129
-
130
-
131
-
132
-
133
-
134
-
135
-
136
-
137
-
138
-
139
-
140
-
141
-
142
-
143
-
144
-
145
-
146
-
147
-
148
-
149
-
150
-
151
-
152
-
153
-
154
-
155
-
156
-
157
-
158
 |
 |

76 Management Discussion
International Business Machines Corporation and Subsidiary Companies
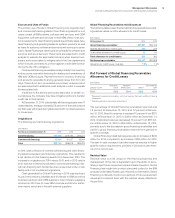
Global Financing optimizes the recovery of residual values by
selling assets sourced from lease returns, leasing used equip-
ment to new clients, or extending lease arrangements with current
clients. Sales of equipment include equipment returned off of a
lease, surplus internal equipment, or used equipment purchased
externally. These sales represented 56.9percent and 55.8per-
cent of Global Financing’s revenue in 2014 and 2013, respectively.
The gross profit margins on these sales were 64.9percent and
58.3percent in 2014 and 2013, respectively. The increase in the
gross profit margin was driven by a margin increase in internal
equipment sales and a shift in mix toward higher margin internal
equipment sales.
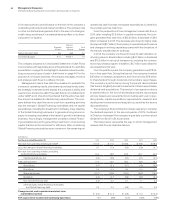
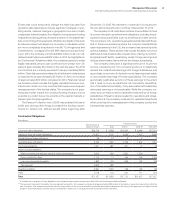
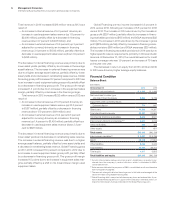
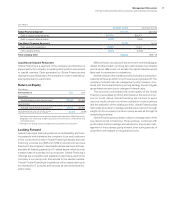
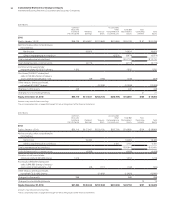
The table below presents the recorded amount of unguaranteed
residual value for sales-type, direct financing and operating leases
at December31, 2014 and 2013. In addition, the table presents
the residual value as a percentage of the related original amount
financed and a run out of when the unguaranteed residual value
assigned to equipment on leases at December31, 2014 is expected
to be returned to the company. In addition to the unguaranteed
residual value, on a limited basis, Global Financing will obtain guar-
antees of the future value of the equipment to be returned at end
of lease. While primarily focused on IBM products, guarantees are
also obtained for certain OEM products. These third-party guar-
antees are included in minimum lease payments as provided for by
accounting standards in the determination of lease classifications
for the covered equipment and provide protection against risk of
loss arising from declines in equipment values for these assets.
The residual value guarantee increases the minimum lease
payments that are utilized in determining the classification of a
lease as a sales-type lease, direct financing lease or operating
lease. The aggregate asset values associated with the guaran-
tees of sales-type leases were $503 million and $479 million for
the financing transactions originated during the years ended
December31, 2014 and 2013, respectively. In 2014, the residual
value guarantee program resulted in the company recognizing
approximately $378 million of revenue that would otherwise have
recognized in future periods as operating lease revenue. If the
company had chosen to not participate in a residual value guar-
antee program in 2014 and prior years, the 2014 impact would be
substantially mitigated by the effect of prior year asset values being
recognized as operating lease revenue in the current year. The
aggregate asset values associated with the guarantees of direct
financing leases were $204 million and $218 million for the financ-
ing transactions originated during the years ended December31,
2014 and 2013, respectively. The associated aggregate guaranteed
future values at the scheduled end of lease were $25 million and
$29 million for the financing transactions originated during the
years ended December31, 2014 and 2013, respectively. The cost
of guarantees was $2 million and $3 million for the years ended
December31, 2014 and 2013, respectively.
Unguaranteed Residual Value
($ in millions)
Total Estimated Run Out of 2014 Balance
At December 31: 2013 2014 2015 2016 2017
2018 and
Beyond
Sales-type and direct financing leases $ 736 $ 671 $122 $187 $224 $138
Operating leases 200 166 56 55 40 15
Total unguaranteed residual value $ 936 $ 837 $178 $242 $264 $153
Related original amount financed $17,642 $15,636
Percentage 5.3% 5.4%
Debt
At December 31: 2014 2013
Debt-to-equity ratio 7.2x 7.2x
The company funds Global Financing through borrowings using a
debt-to-equity ratio target of approximately 7 to 1. The debt used to
fund Global Financing assets is composed of intercompany loans
and external debt. The terms of the intercompany loans are set by
the company to substantially match the term and currency underly-
ing the financing receivable and are based on arm’s-length pricing.
Global Financing provides financing predominantly for the com-
pany’s external client assets, as well as for assets under contract
by other IBM units. As previously stated, the company measures
Global Financing as a stand-alone entity, and accordingly, interest
expense relating to debt supporting Global Financing’s external
client and internal business is included in the “Global Financing
Results of Operations” on page 73 and in noteT, “Segment Infor-
mation,” on pages 145 to 150.
In the company’s Consolidated Statement of Earnings, the
external debt-related interest expense supporting Global Financ
-
ing’s internal financing to the company is reclassified from cost of
financing to interest expense.
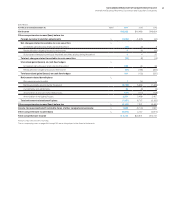
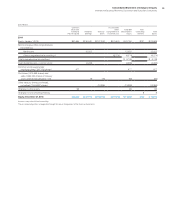
The following table provides additional information on total
company debt. In this table, intercompany activity includes inter-
nal loans and leases at arm’s-length pricing in support of Global
Services’ long-term contracts and other internal activity. The com-
pany believes these assets should be appropriately leveraged in
line with the overall Global Financing business model.