IBM 2014 Annual Report Download - page 24
Download and view the complete annual report
Please find page 24 of the 2014 IBM annual report below. You can navigate through the pages in the report by either clicking on the pages listed below, or by using the keyword search tool below to find specific information within the annual report.-
 1
1 -
2
-
3
-
4
-
5
-
6
-
7
-
8
-
9
-
10
-
11
-
12
-
13
-
 14
14 -
 15
15 -
 16
16 -
 17
17 -
 18
18 -
 19
19 -
 20
20 -
 21
21 -
 22
22 -
 23
23 -
 24
24 -
 25
25 -
 26
26 -
 27
27 -
 28
28 -
 29
29 -
 30
30 -
 31
31 -
 32
32 -
 33
33 -
 34
34 -
35
-
36
-
37
-
38
-
39
-
40
-
41
-
42
-
43
-
44
-
45
-
46
-
47
-
48
-
49
-
50
-
51
-
52
-
53
-
54
-
55
-
56
-
57
-
58
-
59
-
60
-
61
-
62
-
63
-
64
-
65
-
66
-
67
-
68
-
69
-
70
-
71
-
72
-
73
-
74
-
75
-
76
-
77
-
78
-
79
-
80
-
81
-
82
-
83
-
84
-
85
-
86
-
87
-
88
-
89
-
90
-
91
-
92
-
93
-
94
-
95
-
96
-
97
-
98
-
99
-
100
-
101
-
102
-
103
-
104
-
105
-
106
-
107
-
108
-
109
-
110
-
111
-
112
-
113
-
114
-
115
-
116
-
117
-
118
-
119
-
120
-
121
-
122
-
123
-
124
-
125
-
126
-
127
-
128
-
129
-
130
-
131
-
132
-
133
-
134
-
135
-
136
-
137
-
138
-
139
-
140
-
141
-
142
-
143
-
144
-
145
-
146
-
147
-
148
-
149
-
150
-
151
-
152
-
153
-
154
-
155
-
156
-
157
-
158
 |
 |

23
Management Discussion
International Business Machines Corporation and Subsidiary Companies
FORWARD-LOOKING AND
CAUTIONARY STATEMENTS
Certain statements contained in this Annual Report may consti-
tute forward-looking statements within the meaning of the Private
Secur ities Litigation Reform Act of 1995. Any forward-looking
statement in this Annual Report speaks only as of the date on
which it is made; the company assumes no obligation to update
or revise any such statements. Forward-looking statements are
based on the company’s current assumptions regarding future
business and financial performance; these statements, by their
nature, address matters that are uncertain to different degrees.
Forward-looking statements involve a number of risks, uncer-
tainties and other factors that could cause actual results to be
materially different, as discussed more fully elsewhere in this
Annual Report and in the company’s filings with the Securities
and Exchange Commission (SEC), including the company’s 2014
Form 10-K filed on February24, 2015.
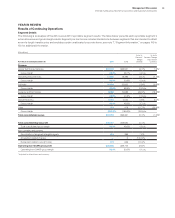
MANAGEMENT DISCUSSION SNAPSHOT
($ and shares in millions except per share amounts)
For the year ended December 31: 2014 2013
Yr.-to-Yr.
Percent/
Margin
Change
Revenue $ 92,793 $ 98,367 (5.7)%*
Gross profit margin 50.0% 49.5% 0.5 pts.
Total expense and other (income) $ 26,421 $ 28,440 (7.1)%
Total expense and other
(income)-to-revenue ratio 28.5% 28.9% (0.4) pts.
Income from continuing
operations before income taxes $ 19,986 $ 20,244 (1.3)%
Provision for income taxes
from continuing operations $ 4,234 $ 3,363 25.9%
Income from continuing
operations $ 15,751 $ 16,881 (6.7)%
Income from continuing
operations margin 17.0% 17.2% (0.2) pts.
Loss from discontinued
operations, net of tax $ (3,729) $ (398) NM
Net income $ 12,022 $ 16,483 (27.1)%
Earnings per share from
continuing operations:
Assuming dilution $ 15.59 $ 15.30 1.9%
Consolidated earnings per share—
assuming dilution $ 11.90 $ 14.94 (20.3)%
Weighted-average shares
outstanding
Assuming dilution 1,010.0 1,103.0 (8.4)%
Assets** $117,532 $126,223 (6.9)%
Liabilities** $105,518 $103,294 2.2%
Equity** $ 12,014 $ 22,929 (47.6)%
* (4.0) percent adjusted for currency; (1.5) percent adjusted for divestitures and
currency.
** At December 31.
NM—Not meaningful
The following table provides the company’s operating (non-GAAP)
earnings for 2014 and 2013.
($ in millions except per share amounts)
For the year ended December 31: 2014 2013
Yr.-to-Yr.
Percent
Change
Net income as reported $12,022 $16,483 (27.1)%
Loss from discontinued operations,
net of tax (3,729) (398) NM
Income from continuing operations $15,751 $16,881 (6.7)%
Non-operating adjustments
(net of tax):
Acquisition-related charges 670 747 (10.3)
Non-operating retirement-related
costs/(income) 280 729 (61.5)
Operating (non-GAAP) earnings* $16,702 $18,356 (9.0)%
Diluted operating (non-GAAP)
earnings per share $ 16.53 $ 16.64 (0.7)%
* See pages 45 and 46 for a more detailed reconciliation of net income to operating
earnings.
NM—Not meaningful
In 2014, the company reported $92.8 billion in revenue, and
delivered $20.0 billion in pre-tax income and diluted earnings
per share from continuing operations of $15.59 as reported and
$16.53 on an operating (non-GAAP) basis. The results of continu-
ing operations exclude a net loss from discontinued operations of
$3.7billion in 2014 and $0.4billion in 2013 related to the expected
divestiture of the Microelectronics business. On a consolidated
basis, net income in 2014 was $12.0billion, with diluted earnings
per share of $11.90. The company generated $16.9 billion in cash
from operations and $12.4 billion in free cash flow in 2014 enabling
shareholder returns of $17.9 billion in gross common stock repur-
chases and dividends.
Total consolidated revenue decreased 5.7percent as reported
and 1percent adjusted for divestitures (3points) and currency
(2points) in 2014 versus 2013. In 2014, the company divested its
industry standard server and customer care businesses. The com-
pany’s strategy is focused on leading in the areas with the most
value in enterprise information technology (IT), and in 2014 the
company made tremendous progress in repositioning its portfolio
and making investments to shift into these areas.
The company’s portfolio includes: strategic imperatives for
growth, recurring core franchises and high value transactional
businesses. These areas of the portfolio span across all of the
company’s business segments. Each area of the portfolio has
different business model characteristics and objectives. The com-
pany’s results in 2014 reflected these characteristics.
First, the company has a set of strategic imperatives for growth
that are focused on the market shifts in data, cloud and engage-
ment. The model for these combined strategic imperatives is to
deliver double-digit revenue growth, with high contribution from
Software, which drives a more profitable business mix. In 2014,
revenue from cloud, analytics, mobile, social and security solutions