IBM 2014 Annual Report Download - page 60
Download and view the complete annual report
Please find page 60 of the 2014 IBM annual report below. You can navigate through the pages in the report by either clicking on the pages listed below, or by using the keyword search tool below to find specific information within the annual report.-
 1
1 -
2
-
3
-
4
-
5
-
6
-
7
-
8
-
9
-
10
-
11
-
12
-
13
-
14
-
15
-
16
-
17
-
18
-
19
-
20
-
21
-
22
-
23
-
24
-
25
-
26
-
27
-
28
-
29
-
30
-
31
-
32
-
33
-
34
-
35
-
36
-
37
-
38
-
39
-
40
-
41
-
42
-
43
-
44
-
45
-
46
-
47
-
48
-
49
-
 50
50 -
 51
51 -
 52
52 -
 53
53 -
 54
54 -
 55
55 -
 56
56 -
 57
57 -
 58
58 -
 59
59 -
 60
60 -
 61
61 -
 62
62 -
 63
63 -
 64
64 -
 65
65 -
 66
66 -
 67
67 -
 68
68 -
 69
69 -
 70
70 -
71
-
72
-
73
-
74
-
75
-
76
-
77
-
78
-
79
-
80
-
81
-
82
-
83
-
84
-
85
-
86
-
87
-
88
-
89
-
90
-
91
-
92
-
93
-
94
-
95
-
96
-
97
-
98
-
99
-
100
-
101
-
102
-
103
-
104
-
105
-
106
-
107
-
108
-
109
-
110
-
111
-
112
-
113
-
114
-
115
-
116
-
117
-
118
-
119
-
120
-
121
-
122
-
123
-
124
-
125
-
126
-
127
-
128
-
129
-
130
-
131
-
132
-
133
-
134
-
135
-
136
-
137
-
138
-
139
-
140
-
141
-
142
-
143
-
144
-
145
-
146
-
147
-
148
-
149
-
150
-
151
-
152
-
153
-
154
-
155
-
156
-
157
-
158
 |
 |

59
Management Discussion
International Business Machines Corporation and Subsidiary Companies
in the UNIX market, and took two actions to improve its business
model in Power Systems. First, it is making the platform more rel-
evant to clients. To achieve this:
• In the fourth quarter of 2013, the company introduced a new
Integrated Facility for Linux offering which enables clients to
run Linux workloads in their existing servers. This mirrors the
successful strategy the company executed on the Systemz
platform;
• The company will expand its Linux relevance even further
with POWER8 in 2014, which will provide additional big data
and cloud capabilities; and
• Through the company’s OpenPOWER consortium it is making
Power technology available to an open development alliance,
building an ecosystem around the Power technologies.
Secondly, even with these additional capabilities, the company
recognizes that the size of the Power platform will not return to
prior revenue levels. The company will take action by right-sizing
the business for the demand characteristics it expects.
Systemx revenue decreased 13.5percent (13percent adjusted
for currency) in 2013 versus 2012. High-end Systemx revenue
decreased 16percent (16percent adjusted for currency) and
blades revenue declined 45percent (45percent adjusted for cur-
rency) in 2013 compared to 2012. The declines in both high-end
Systemx and blade were partially offset by increased revenue
driven by Pure Systems.
Storage revenue decreased 10.8percent (10percent adjusted
for currency) in 2013 versus 2012. The company’s flash solu-
tions continued to gain momentum in 2013 with positive revenue
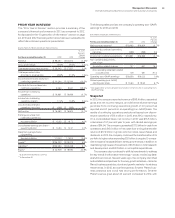
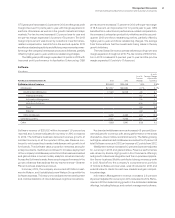
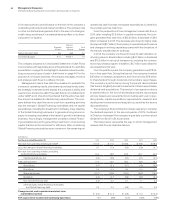
Geographic Revenue
In addition to the revenue presentation by reportable segment, the company also measures revenue performance on a geographic basis.
The following geographic, regional and country-specific revenue performance excludes OEM revenue.
($ in millions)
For the year ended December 31: 2013 2012
Yr.-to-Yr.
Percent
Change
Yr.-to-Yr.
Percent Change
Adjusted for
Currency
Total revenue $98,367 $102,874 (4.4)% (2.3)%
Geographies $97,800 $102,268 (4.4)% (2.2)%
Americas 43,249 44,556 (2.9) (2.0)
Europe/Middle East/Africa 31,628 31,775 (0.5) (2.1)
Asia Pacific 22,923 25,937 (11.6) (2.8)
Major markets (4.2)% (2.2)%
Growth markets (4.9)% (2.4)%
BRIC countries (8.2)% (5.6)%
growth. The Storwize products delivered double-digit growth,
which were more than offset by declines in legacy OEM mid-range
offerings, and declines in high-end offerings driven by significant
pricing pressure.
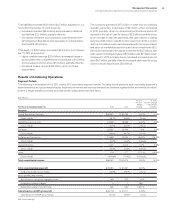
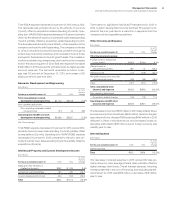
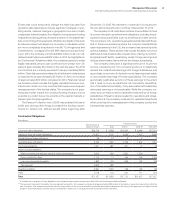
($ in millions)
For the year ended December 31: 2013 2012
Yr.-to-Yr.
Percent/
Margin
Change
Systems and Technology
External gross profit $5,299 $6,966 (23.9)%
External gross profit margin 40.8% 43.4% (2.6) pts.
Pre-tax income $ 213 $1,866 (88.6)%
Pre-tax margin 1.6%11.2%(9.6) pts.
The decrease in external gross profit in 2013 versus 2012 was due
to lower revenue and a lower overall gross profit margin reflecting
the business model challenges. Overall gross margin decreased
2.6points year to year in 2013 driven by lower margins in Power
Systems, Systemx and Storage as well as a decline due to revenue
mix, partially offset by margin improvement in Systemz.
Systems and Technology’s pre-tax income decreased
88.6percent to $213 million in 2013. Pre-tax margin decreased
9.6points in 2013 versus 2012.
Global Financing
See pages 73 through 77 for an analysis of Global Financing’s seg-
ment results.