IBM 2014 Annual Report Download - page 134
Download and view the complete annual report
Please find page 134 of the 2014 IBM annual report below. You can navigate through the pages in the report by either clicking on the pages listed below, or by using the keyword search tool below to find specific information within the annual report.-
 1
1 -
2
-
3
-
4
-
5
-
6
-
7
-
8
-
9
-
10
-
11
-
12
-
13
-
14
-
15
-
16
-
17
-
18
-
19
-
20
-
21
-
22
-
23
-
24
-
25
-
26
-
27
-
28
-
29
-
30
-
31
-
32
-
33
-
34
-
35
-
36
-
37
-
38
-
39
-
40
-
41
-
42
-
43
-
44
-
45
-
46
-
47
-
48
-
49
-
50
-
51
-
52
-
53
-
54
-
55
-
56
-
57
-
58
-
59
-
60
-
61
-
62
-
63
-
64
-
65
-
66
-
67
-
68
-
69
-
70
-
71
-
72
-
73
-
74
-
75
-
76
-
77
-
78
-
79
-
80
-
81
-
82
-
83
-
84
-
85
-
86
-
87
-
88
-
89
-
90
-
91
-
92
-
93
-
94
-
95
-
96
-
97
-
98
-
99
-
100
-
101
-
102
-
103
-
104
-
105
-
106
-
107
-
108
-
109
-
110
-
111
-
112
-
113
-
114
-
115
-
116
-
117
-
118
-
119
-
120
-
121
-
122
-
123
-
 124
124 -
 125
125 -
 126
126 -
 127
127 -
 128
128 -
 129
129 -
 130
130 -
 131
131 -
 132
132 -
 133
133 -
 134
134 -
 135
135 -
 136
136 -
 137
137 -
 138
138 -
 139
139 -
 140
140 -
 141
141 -
 142
142 -
 143
143 -
 144
144 -
145
-
146
-
147
-
148
-
149
-
150
-
151
-
152
-
153
-
154
-
155
-
156
-
157
-
158
 |
 |

Notes to Consolidated Financial Statements
International Business Machines Corporation and Subsidiary Companies
133
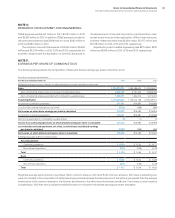
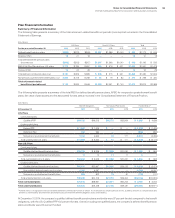
Plan Financial Information
Summary of Financial Information
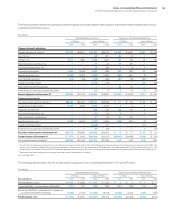
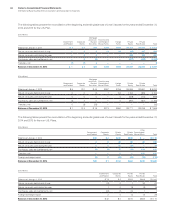
The following table presents a summary of the total retirement-related benefits net periodic (income)/cost recorded in the Consolidated
Statement of Earnings.
($ in millions)
U.S. Plans Non-U.S. Plans Total
For the year ended December 31: 2014 2013 2012 2014 2013 2012 2014 2013 2012
Defined benefit pension plans $(833) $(223) $(526) $1,267 $1,396 $1,040 $ 434 $1,173 $ 515
Retention Plan 15 21 18 —— — 15 21 18
Total defined benefit pension plans
(income)/cost $(818) $(202) $(507) $1,267 $1,396 $1,040 $ 449 $1,195 $ 533
IBM 401(k) Plus Plan and non-U.S. plans $ 713 $ 785 $ 857 $ 526 $ 575 $ 621 $1,239 $1,361 $1,478
Excess 401(k) 14 24 29 —— — 14 24 29
Total defined contribution plans cost $ 727 $ 809 $ 885 $ 526 $ 575 $ 621 $1,253 $1,384 $1,506
Nonpension postretirement benefit plans cost $ 206 $ 218 $ 268 $ 66 $ 79 $ 82 $ 272 $ 298 $ 350
Total retirement-related
benefits net periodic cost $ 115 $ 826 $ 646 $1,859 $2,051 $1,743 $1,974 $2,876 $2,389
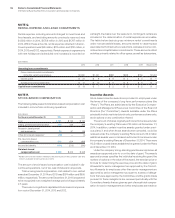
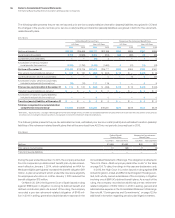
The following table presents a summary of the total PBO for defined benefit pension plans, APBO for nonpension postretirement benefit
plans, fair value of plan assets and the associated funded status recorded in the Consolidated Statement of Financial Position.
($ in millions)
Benefit Obligations Fair Value of Plan Assets Funded Status*
At December 31: 2014 2013 2014 2013 2014 2013
U.S. Plans
Overfunded plans
Qualified PPP $54,708 $49,315 $55,772 $53,954 $ 1,065 $ 4,639
Underfunded plans
Excess PPP $ 1,602 $ 1,425 $ — $ — $ (1,602) $ (1,425)
Retention Plan 334 294 ——(334) (294)
Nonpension postretirement benefit plan 5,053 4,633 16 177 (5,037) (4,456)
Total underfunded U.S. plans $ 6,989 $ 6,352 $ 16 $ 177 $ (6,973) $ (6,175)
Non-U.S. Plans
Overfunded plans
Qualified defined benefit pension plans $16,794 $ 9,336 $17,888 $10,240 $ 1,094 $ 904
Nonpension postretirement benefit plans 11 10 11 11 01
Total overfunded non-U.S. plans $16,804 $ 9,346 $17,898 $10,251 $ 1,094 $ 905
Underfunded plans
Qualified defined benefit pension plans $26,278 $32,697 $21,655 $29,223 $ (4,623) $ (3,474)
Nonqualified defined benefit pension plans 6,762 6,587 ——(6,762) (6,587)
Nonpension postretirement benefit plans 806 822 73 81 (733) (741)
Total underfunded non-U.S. plans $33,846 $40,106 $21,729 $29,304 $(12,118) $(10,802)
Total overfunded plans $71,512 $58,661 $73,671 $64,205 $ 2,159 $ 5,544
Total underfunded plans $40,836 $46,458 $21,745 $29,481 $(19,091) $(16,977)
* Funded status is recognized in the Consolidated Statement of Financial Position as follows: Asset amounts as prepaid pension assets; (Liability) amounts as compensation and
benefits (current liability) and retirement and nonpension postretirement benefit obligations (noncurrent liability).
At December 31, 2014, the company’s qualified defined benefit pension plans worldwide were 97percent funded compared to the benefit
obligations, with the U.S. Qualified PPP 102percent funded. Overall, including nonqualified plans, the company’s defined benefit pension
plans worldwide were 90percent funded.