IBM 2014 Annual Report Download - page 43
Download and view the complete annual report
Please find page 43 of the 2014 IBM annual report below. You can navigate through the pages in the report by either clicking on the pages listed below, or by using the keyword search tool below to find specific information within the annual report.-
 1
1 -
2
-
3
-
4
-
5
-
6
-
7
-
8
-
9
-
10
-
11
-
12
-
13
-
14
-
15
-
16
-
17
-
18
-
19
-
20
-
21
-
22
-
23
-
24
-
25
-
26
-
27
-
28
-
29
-
30
-
31
-
32
-
 33
33 -
 34
34 -
 35
35 -
 36
36 -
 37
37 -
 38
38 -
 39
39 -
 40
40 -
 41
41 -
 42
42 -
 43
43 -
 44
44 -
 45
45 -
 46
46 -
 47
47 -
 48
48 -
 49
49 -
 50
50 -
 51
51 -
 52
52 -
 53
53 -
54
-
55
-
56
-
57
-
58
-
59
-
60
-
61
-
62
-
63
-
64
-
65
-
66
-
67
-
68
-
69
-
70
-
71
-
72
-
73
-
74
-
75
-
76
-
77
-
78
-
79
-
80
-
81
-
82
-
83
-
84
-
85
-
86
-
87
-
88
-
89
-
90
-
91
-
92
-
93
-
94
-
95
-
96
-
97
-
98
-
99
-
100
-
101
-
102
-
103
-
104
-
105
-
106
-
107
-
108
-
109
-
110
-
111
-
112
-
113
-
114
-
115
-
116
-
117
-
118
-
119
-
120
-
121
-
122
-
123
-
124
-
125
-
126
-
127
-
128
-
129
-
130
-
131
-
132
-
133
-
134
-
135
-
136
-
137
-
138
-
139
-
140
-
141
-
142
-
143
-
144
-
145
-
146
-
147
-
148
-
149
-
150
-
151
-
152
-
153
-
154
-
155
-
156
-
157
-
158
 |
 |

42 Management Discussion
International Business Machines Corporation and Subsidiary Companies
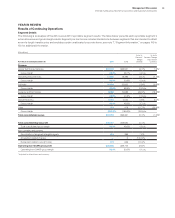
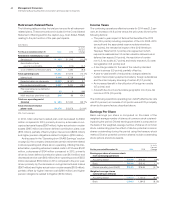
Retirement-Related Plans
The following table provides the total pre-tax cost for all retirement-
related plans. These amounts are included in the Consolidated
Statement of Earnings within the caption (e.g., Cost, SG&A, RD&E)
relating to the job function of the plan participants.
($ in millions)
For the year ended December 31: 2014 2013
Yr.-to-Yr.
Percent
Change
Retirement-related plans—cost
Service cost $ 482 $ 545 (11.5)%
Amortization of prior
service cost/(credits) (114) (114) (0.1)
Cost of defined contribution plans 1,253 1,384 (9.5)
Total operating costs $ 1,621 $ 1,815 (10.7)%
Interest cost 3,994 3,728 7.1
Expected return on plan assets (6,351) (6,187) 2.7
Recognized actuarial losses 2,467 3,434 (28.2)
Plan amendments/curtailments/
settlements 25 0 NM
Multi-employer plan/other costs 218 86 154.5
Total non-operating costs/
(income) $ 353 $ 1,062 (66.7)%
Total retirement-related
plans—cost $ 1,974 $ 2,876 (31.4)%
NM—Not meaningful
In 2014, total retirement-related plan cost decreased by $902
million compared to 2013, primarily driven by a decrease in rec-
ognized actuarial losses ($967 million), higher actual return on plan
assets ($165 million) and lower defined contribution plans cost
($131 million), partially offset by higher interest cost ($266 million)
and higher pension obligations related to litigation ($139 million).
As discussed in the “Operating (non-GAAP) Earnings” section
on page 22, the company characterizes certain retirement-related
costs as operating and others as non-operating. Utilizing this char-
acterization, operating retirement-related costs in 2014 were $1,621
million, a decrease of $194 million compared to 2013, primarily
driven by lower defined contribution plans cost ($131 million) and
decreased service cost ($63 million). Non-operating costs of $353
million decreased $709 million in 2014, compared to the prior year,
driven primarily by the decrease in recognized actuarial losses
($967 million) and higher actual return on plan assets ($165 million),
partially offset by higher interest cost ($266 million) and higher
pension obligations related to litigation ($139 million).
Income Taxes
The continuing operations effective tax rate for 2014 was 21.2per-
cent, an increase of 4.6points versus the prior year, driven by the
following factors:
• The year-to-year impact of factors that benefited the 2013
rate (14.5points), including completion of the U.S. 2008–2010
tax audit and the associated reserve redeterminations
(11.1points), the retroactive impact of the 2012 American
Taxpayer Relief Act (0.7points), a tax agreement which
required a reassessment of certain valuation allowances on
deferred tax assets (1.4points), the resolution of certain
non-U.S. tax audits (0.7points) and newly enacted U.S. state
tax legislation (0.6points); and
• A tax charge related to the sale of the industry standard
server business (0.9points); partially offset by;
• A year-to-year benefit of reduced tax charges related to
certain intercompany payments made by foreign subsidiaries
and the intercompany licensing of certain IP (3.7points);
• An increased benefit in the utilization of foreign tax credits
(4.7points); and
• A benefit due to a more favorable geographic mix of pre-tax
income in 2014 (2.5points).
The continuing operations operating (non-GAAP) effective tax rate
was 21.0percent, an increase of 4.0points versus 2013 principally
driven by the same factors described above.
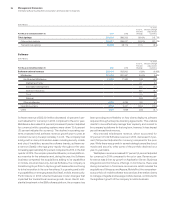
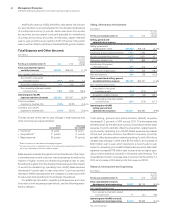
Earnings Per Share
Basic earnings per share is computed on the basis of the
weighted-average number of shares of common stock outstand-
ing during the period. Diluted earnings per share is computed on
the basis of the weighted-average number of shares of common
stock outstanding plus the effect of dilutive potential common
shares outstanding during the period using the treasury stock
method. Dilutive potential common shares include outstanding
stock options and stock awards.
For the year ended December 31: 2014 2013
Yr.-to-Yr.
Percent
Change
Earnings per share of common stock
from continuing operations
Assuming dilution $15.59 $15.30 1.9%
Basic $15.68 $15.42 1.7%
Diluted operating (non-GAAP) $16.53 $16.64 (0.7)%
Weighted-average shares
outstanding (in millions)
Assuming dilution 1,010.0 1,103.0 (8.4)%
Basic 1,004.3 1,094.5 (8.2)%