IBM 2014 Annual Report Download - page 143
Download and view the complete annual report
Please find page 143 of the 2014 IBM annual report below. You can navigate through the pages in the report by either clicking on the pages listed below, or by using the keyword search tool below to find specific information within the annual report.-
 1
1 -
2
-
3
-
4
-
5
-
6
-
7
-
8
-
9
-
10
-
11
-
12
-
13
-
14
-
15
-
16
-
17
-
18
-
19
-
20
-
21
-
22
-
23
-
24
-
25
-
26
-
27
-
28
-
29
-
30
-
31
-
32
-
33
-
34
-
35
-
36
-
37
-
38
-
39
-
40
-
41
-
42
-
43
-
44
-
45
-
46
-
47
-
48
-
49
-
50
-
51
-
52
-
53
-
54
-
55
-
56
-
57
-
58
-
59
-
60
-
61
-
62
-
63
-
64
-
65
-
66
-
67
-
68
-
69
-
70
-
71
-
72
-
73
-
74
-
75
-
76
-
77
-
78
-
79
-
80
-
81
-
82
-
83
-
84
-
85
-
86
-
87
-
88
-
89
-
90
-
91
-
92
-
93
-
94
-
95
-
96
-
97
-
98
-
99
-
100
-
101
-
102
-
103
-
104
-
105
-
106
-
107
-
108
-
109
-
110
-
111
-
112
-
113
-
114
-
115
-
116
-
117
-
118
-
119
-
120
-
121
-
122
-
123
-
124
-
125
-
126
-
127
-
128
-
129
-
130
-
131
-
132
-
 133
133 -
 134
134 -
 135
135 -
 136
136 -
 137
137 -
 138
138 -
 139
139 -
 140
140 -
 141
141 -
 142
142 -
 143
143 -
 144
144 -
 145
145 -
 146
146 -
 147
147 -
 148
148 -
 149
149 -
 150
150 -
 151
151 -
 152
152 -
 153
153 -
154
-
155
-
156
-
157
-
158
 |
 |

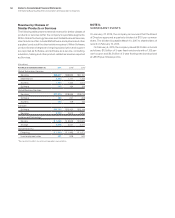
Notes to Consolidated Financial Statements
International Business Machines Corporation and Subsidiary Companies
142
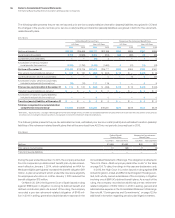
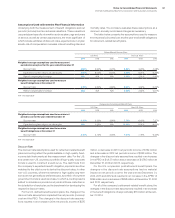
The following tables present the reconciliation of the beginning and ending balances of Level3 assets for the years ended December31,
2014 and 2013 for the U.S. Plan.
($ in millions)
Government
and Related
Corporate
Bonds
Mortgage
and Asset-
Backed
Securities
Fixed Income
Commingled/
Mutual Funds
Hedge
Funds
Private
Equity
Private
Real Estate Total
Balance at January 1, 2014 $ 1 $ 5 $19 $274 $860 $3,771 $3,038 $ 7,968
Return on assets held at end of year — 0 0 21 28 (10) 197 238
Return on assets sold during the year — 0 0 — — 332 199 531
Purchases, sales and settlements, net — 0 (3) — — (807) (492) (1,302)
Transfers, net (1) (1) 4 — — — — 2
Balance at December 31, 2014 $ — $ 4 $20 $295 $889 $3,287 $2,942 $ 7,437
($ in millions)
Government
and Related
Corporate
Bonds
Mortgage
and Asset-
Backed
Securities
Fixed Income
Commingled/
Mutual Funds
Hedge
Funds
Private
Equity
Private
Real Estate Total
Balance at January 1, 2013 $ 6 $11 $ 45 $267 $756 $4,085 $2,861 $ 8,032
Return on assets held at end of year 0 0 (1) 7 104 1,104 889 2,103
Return on assets sold during the year 0 0 0 — 0 (528) (412) (939)
Purchases, sales and settlements, net (5) 3 0 — 0 (891) (301) (1,194)
Transfers, net 0 (8) (26) — — — — (33)
Balance at December 31, 2013 $ 1 $ 5 $ 19 $274 $860 $3,771 $3,038 $ 7,968
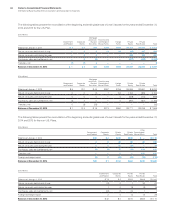
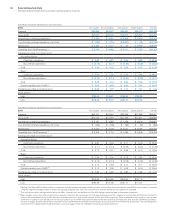
The following tables present the reconciliation of the beginning and ending balances of Level3 assets for the years ended December31,
2014 and 2013 for the non-U.S. Plans.
($ in millions)
Government
and Related
Corporate
Bonds
Private
Equity
Private
Real Estate
Other
Commingled/
Mutual Funds Tot al
Balance at January 1, 2014 $42 $ 4 $410 $655 $ — $1,110
Return on assets held at end of year 3 0 26 83 26 138
Return on assets sold during the year 0 0 46 (12) — 34
Purchases, sales and settlements, net (8) (3) 75 (13) 104 155
Transfers, net — — 0 — 102 102
Foreign exchange impact (5) 0 (45) (49) (12) (110)
Balance at December 31, 2014 $32 $ 1 $513 $664 $220 $1,429
($ in millions)
Government
and Related
Corporate
Bonds
Private
Equity
Private
Real Estate Total
Balance at January 1, 2013 $ 76 $ 5 $353 $609 $1,042
Return on assets held at end of year (12) 0 1 33 22
Return on assets sold during the year 1 0 18 (3) 16
Purchases, sales and settlements, net (24) (1) 26 1 1
Foreign exchange impact 2 0 12 15 29
Balance at December 31, 2013 $ 42 $ 4 $410 $655 $1,110