IBM 2014 Annual Report Download - page 104
Download and view the complete annual report
Please find page 104 of the 2014 IBM annual report below. You can navigate through the pages in the report by either clicking on the pages listed below, or by using the keyword search tool below to find specific information within the annual report.-
 1
1 -
2
-
3
-
4
-
5
-
6
-
7
-
8
-
9
-
10
-
11
-
12
-
13
-
14
-
15
-
16
-
17
-
18
-
19
-
20
-
21
-
22
-
23
-
24
-
25
-
26
-
27
-
28
-
29
-
30
-
31
-
32
-
33
-
34
-
35
-
36
-
37
-
38
-
39
-
40
-
41
-
42
-
43
-
44
-
45
-
46
-
47
-
48
-
49
-
50
-
51
-
52
-
53
-
54
-
55
-
56
-
57
-
58
-
59
-
60
-
61
-
62
-
63
-
64
-
65
-
66
-
67
-
68
-
69
-
70
-
71
-
72
-
73
-
74
-
75
-
76
-
77
-
78
-
79
-
80
-
81
-
82
-
83
-
84
-
85
-
86
-
87
-
88
-
89
-
90
-
91
-
92
-
93
-
 94
94 -
 95
95 -
 96
96 -
 97
97 -
 98
98 -
 99
99 -
 100
100 -
 101
101 -
 102
102 -
 103
103 -
 104
104 -
 105
105 -
 106
106 -
 107
107 -
 108
108 -
 109
109 -
 110
110 -
 111
111 -
 112
112 -
 113
113 -
 114
114 -
115
-
116
-
117
-
118
-
119
-
120
-
121
-
122
-
123
-
124
-
125
-
126
-
127
-
128
-
129
-
130
-
131
-
132
-
133
-
134
-
135
-
136
-
137
-
138
-
139
-
140
-
141
-
142
-
143
-
144
-
145
-
146
-
147
-
148
-
149
-
150
-
151
-
152
-
153
-
154
-
155
-
156
-
157
-
158
 |
 |

Notes to Consolidated Financial Statements
International Business Machines Corporation and Subsidiary Companies
103
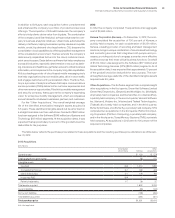
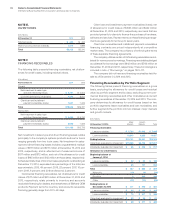
NOTE D.
FINANCIAL INSTRUMENTS
Fair Value Measurements
Financial Assets and Liabilities Measured at Fair Value on a Recurring Basis
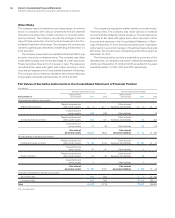
The following tables present the company’s financial assets and financial liabilities that are measured at fair value on a recurring basis
at December31, 2014 and 2013.
($ in millions)
At December 31, 2014: Level 1 Level 2 Level 3 To tal
Assets
Cash equivalents
(1)
Time deposits and certificates of deposit $ — $3,517 $— $3,517
Commercial paper — 764 — 764
Money market funds 662 — — 662
U.S. government securities — 410 — 410
Other securities — 6 — 6
Total 662 4,697 — 5,359 (5)
Debt securities—noncurrent
(2) 1 8 — 9
Trading security investments
(2) 74 — — 74
Available-for-sale equity investments
(2) 243 — — 243
Derivative assets
(3)
Interest rate contracts — 633 — 633
Foreign exchange contracts — 775 — 775
Equity contracts — 24 — 24
Total — 1,432 — 1,432 (6)
Total assets $980 $6,138 $— $7,118 (6)
Liabilities
Derivative liabilities
(4)
Foreign exchange contracts — 177 — 177
Equity contracts — 19 — 19
Total liabilities $ — $ 196 $— $ 196 (6)
(1) Included within cash and cash equivalents in the Consolidated Statement of Financial Position.
(2) Included within investments and sundry assets in the Consolidated Statement of Financial Position.
(3)
The gross balances of derivative assets contained within prepaid expenses and other current assets, and investments and sundry assets in the Consolidated Statement of
Financial Position at December31, 2014 were $751 million and $681 million, respectively.
(4)
The gross balances of derivative liabilities contained within other accrued expenses and liabilities, and other liabilities in the Consolidated Statement of Financial Position at
December31, 2014 were $165 million and $31 million, respectively.
(5) Available-for-sale securities with carrying values that approximate fair value.
(6)
If derivative exposures covered by a qualifying master netting agreement had been netted in the Consolidated Statement of Financial Position, the total derivative asset and liability
positions would have been reduced by $97 million each.