IBM 2014 Annual Report Download - page 34
Download and view the complete annual report
Please find page 34 of the 2014 IBM annual report below. You can navigate through the pages in the report by either clicking on the pages listed below, or by using the keyword search tool below to find specific information within the annual report.-
 1
1 -
2
-
3
-
4
-
5
-
6
-
7
-
8
-
9
-
10
-
11
-
12
-
13
-
14
-
15
-
16
-
17
-
18
-
19
-
20
-
21
-
22
-
23
-
 24
24 -
 25
25 -
 26
26 -
 27
27 -
 28
28 -
 29
29 -
 30
30 -
 31
31 -
 32
32 -
 33
33 -
 34
34 -
 35
35 -
 36
36 -
 37
37 -
 38
38 -
 39
39 -
 40
40 -
 41
41 -
 42
42 -
 43
43 -
 44
44 -
45
-
46
-
47
-
48
-
49
-
50
-
51
-
52
-
53
-
54
-
55
-
56
-
57
-
58
-
59
-
60
-
61
-
62
-
63
-
64
-
65
-
66
-
67
-
68
-
69
-
70
-
71
-
72
-
73
-
74
-
75
-
76
-
77
-
78
-
79
-
80
-
81
-
82
-
83
-
84
-
85
-
86
-
87
-
88
-
89
-
90
-
91
-
92
-
93
-
94
-
95
-
96
-
97
-
98
-
99
-
100
-
101
-
102
-
103
-
104
-
105
-
106
-
107
-
108
-
109
-
110
-
111
-
112
-
113
-
114
-
115
-
116
-
117
-
118
-
119
-
120
-
121
-
122
-
123
-
124
-
125
-
126
-
127
-
128
-
129
-
130
-
131
-
132
-
133
-
134
-
135
-
136
-
137
-
138
-
139
-
140
-
141
-
142
-
143
-
144
-
145
-
146
-
147
-
148
-
149
-
150
-
151
-
152
-
153
-
154
-
155
-
156
-
157
-
158
 |
 |

33
Management Discussion
International Business Machines Corporation and Subsidiary Companies
YEAR IN REVIEW
Results of Continuing Operations
Segment Details
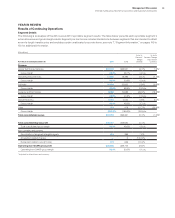
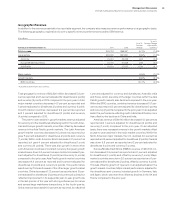
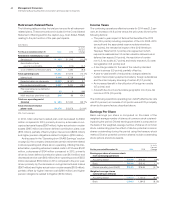
The following is an analysis of the 2014 versus 2013 reportable segment results. The table below presents each reportable segment’s
external revenue and gross margin results. Segment pre-tax income includes transactions between segments that are intended to reflect
an arm’s-length transfer price and excludes certain unallocated corporate items; see noteT, “Segment Information,” on pages 145 to
150 for additional information.
($ in millions)
For the year ended December 31: 2014 2013
Yr.-to-Yr.
Percent/
Margin
Change
Yr.-to-Yr.
Percent Change
Adjusted for
Currency
Revenue
Global Technology Services $37,130 $38,551 (3.7)% 1.6%*
Gross margin 38.3% 38.1% 0.2 pts.
Global Business Services 17,825 18,396 (3.1)% (1.1)%
Gross margin 30.8% 30.9% 0.0 pts.
Software 25,434 25,932 (1.9)% (0.9)%
Gross margin 88.6% 88.8% (0.2) pts.
Systems and Technology 9,996 12,988 (23.0)% (16.8)%*
Gross margin 39.5% 40.8% (1.3) pts.
Global Financing 2,034 2,022 0.6% 3.0%
Gross margin 49.4% 45.6% 3.7 pts.
Other 374 478 (21.7)% (20.4)%
Gross margin (215.0)% (195.6)% (19.4) pts.
Total consolidated revenue $92,793 $98,367 (5.7)% (1.5)%*
Total consolidated gross profit $46,407 $48,684 (4.7)%
Total consolidated gross margin 50.0% 49.5% 0.5 pts.
Non-operating adjustments
Amortization of acquired intangible assets 416 388 7.2%
Acquisition-related charges —5 (100.0)%
Retirement-related costs/(income) 173 629 (72.4)%
Operating (non-GAAP) gross profit $46,996 $49,706 (5.5)%
Operating (non-GAAP) gross margin 50.6% 50.5% 0.1 pts.
* Adjusted for divestitures and currency.