IBM 2014 Annual Report Download - page 35
Download and view the complete annual report
Please find page 35 of the 2014 IBM annual report below. You can navigate through the pages in the report by either clicking on the pages listed below, or by using the keyword search tool below to find specific information within the annual report.-
 1
1 -
2
-
3
-
4
-
5
-
6
-
7
-
8
-
9
-
10
-
11
-
12
-
13
-
14
-
15
-
16
-
17
-
18
-
19
-
20
-
21
-
22
-
23
-
24
-
 25
25 -
 26
26 -
 27
27 -
 28
28 -
 29
29 -
 30
30 -
 31
31 -
 32
32 -
 33
33 -
 34
34 -
 35
35 -
 36
36 -
 37
37 -
 38
38 -
 39
39 -
 40
40 -
 41
41 -
 42
42 -
 43
43 -
 44
44 -
 45
45 -
46
-
47
-
48
-
49
-
50
-
51
-
52
-
53
-
54
-
55
-
56
-
57
-
58
-
59
-
60
-
61
-
62
-
63
-
64
-
65
-
66
-
67
-
68
-
69
-
70
-
71
-
72
-
73
-
74
-
75
-
76
-
77
-
78
-
79
-
80
-
81
-
82
-
83
-
84
-
85
-
86
-
87
-
88
-
89
-
90
-
91
-
92
-
93
-
94
-
95
-
96
-
97
-
98
-
99
-
100
-
101
-
102
-
103
-
104
-
105
-
106
-
107
-
108
-
109
-
110
-
111
-
112
-
113
-
114
-
115
-
116
-
117
-
118
-
119
-
120
-
121
-
122
-
123
-
124
-
125
-
126
-
127
-
128
-
129
-
130
-
131
-
132
-
133
-
134
-
135
-
136
-
137
-
138
-
139
-
140
-
141
-
142
-
143
-
144
-
145
-
146
-
147
-
148
-
149
-
150
-
151
-
152
-
153
-
154
-
155
-
156
-
157
-
158
 |
 |

34 Management Discussion
International Business Machines Corporation and Subsidiary Companies
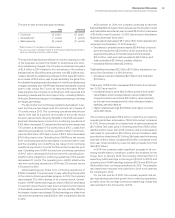
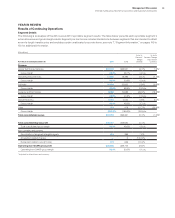
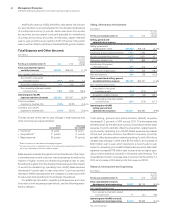
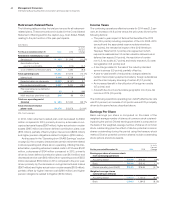
Global Services
In 2014, the Global Services segments, Global Technology Services
(GTS) and Global Business Services (GBS), delivered revenue of
$54,954 million, a decrease of 3.5percent as reported, but an
increase of 1percent adjusted for the divestitures of the customer
care and industry standard server businesses (2points) and cur-
rency (2points). Pre-tax income decreased 8.4percent and the
pre-tax margin decreased 0.8points to 16.5percent. Total outsourc-
ing revenue of $24,520 million decreased 6.3percent as reported,
but was flat year to year when adjusted for currency (2points) and
the divestitures (4points). Total transactional revenue of $23,581
million decreased 0.4percent, but increased 2percent adjusted
for currency.
($ in millions)
For the year ended December 31: 2014 2013
Yr.-to-Yr.
Percent
Change
Yr.-to-Yr.
Percent Change
Adjusted for
Currency
Global Services external revenue $54,954 $56,947 (3.5)% 0.7%*
Global Technology Services $37,130 $38,551 (3.7)% 1.6%*
Outsourcing 20,770 22,060 (5.8) 1.2*
Integrated Technology Services 9,506 9,380 1.3 3.7
Maintenance 6,853 7,111 (3.6) (0.1)*
Global Business Services $17,825 $18,396 (3.1)% (1.1)%
Outsourcing 3,750 4,097 (8.5) (6.1)
Consulting and Systems Integration 14,075 14,298 (1.6) 0.4
* Adjusted for divestitures and currency.
Global Technology Services revenue of $37,130 million decreased
3.7percent as reported in 2014 compared to the prior year, but
increased 2percent adjusted for currency (3points) and the dives-
titures (3points). Integrated Technology Services (ITS) revenue
grew 1.3percent (4percent adjusted for currency) compared to
2013. The SoftLayer platform, which provides highly differenti ated
solutions for clients looking to deploy across public, private or
hybrid clouds all unified on one platform, had strong performance.
Throughout the year, SoftLayer attracted new workloads to the
platform and the company is investing to expand its datacenter
footprint globally. GTS Outsourcing revenue decreased 5.8percent
as reported in 2014, but increased 1percent adjusted for currency
(2points) and the divestitures (5points). Growth was driven by
performance from the substantial new contracts brought on during
2013. In 2014, clients continued to sign large outsourcing engage-
ments that leverage the company’s cloud, business analytics and
mobile solutions. Maintenance revenue decreased 3.6percent
but was flat year to year adjusted for the divestiture of the industry
standard server business (1 point) and currency (2 points).
Global Business Services revenue of $17,825 million decreased
3.1percent (1percent adjusted for currency) compared to the prior
year. Consulting and Systems Integration (C&SI) revenue declined
1.6percent as reported, but was flat adjusted for currency in 2014.
There was strong growth in the practices that are highly differenti-
ated in the marketplace which address cloud, analytics, mobile
and social, offset by declines in the more traditional parts of the
portfolio, such as back office implementations. As the new offer-
ings continue to become a larger part of the portfolio they will
contribute more meaningfully to the revenue performance. In
July, the company announced a strategic partnership with Apple
to deliver a new class of “enterprise ready” MobileFirst business
applications for iOS combining mobility and analytics. In the fourth
quarter of 2014, the first applications were launched with additional
applications focused on healthcare, energy and utilities expected
in the first quarter of 2015. GBS Outsourcing revenue decreased
8.5percent (6percent adjusted for currency) in 2014, but had
sequential improvement in the year-to-year growth rate in the last
two quarters of the year adjusted for currency. Throughout the
year, performance was impacted by pricing pressure and client
renegotiations, as well as a reduction in elective projects.
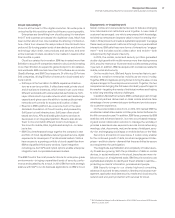
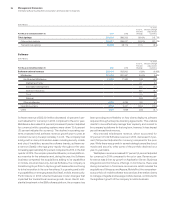
($ in millions)
For the year ended December 31: 2014 2013
Yr.-to-Yr.
Percent/
Margin
Change
Global Services
Global Technology Services
External gross profit $14,237 $14,691 (3.1)%
External gross profit margin 38.3% 38.1% 0.2 pts.
Pre-tax income $ 6,340 $ 6,983 (9.2)%
Pre-tax margin 16.7% 17.6% (1.0) pts.
Global Business Services
External gross profit $ 5,493 $ 5,676 (3.2)%
External gross profit margin 30.8% 30.9% 0.0 pts.
Pre-tax income $ 2,999 $ 3,214 (6.7)%
Pre-tax margin 16.3% 16.8% (0.5) pts.