IBM 2014 Annual Report Download - page 48
Download and view the complete annual report
Please find page 48 of the 2014 IBM annual report below. You can navigate through the pages in the report by either clicking on the pages listed below, or by using the keyword search tool below to find specific information within the annual report.-
 1
1 -
2
-
3
-
4
-
5
-
6
-
7
-
8
-
9
-
10
-
11
-
12
-
13
-
14
-
15
-
16
-
17
-
18
-
19
-
20
-
21
-
22
-
23
-
24
-
25
-
26
-
27
-
28
-
29
-
30
-
31
-
32
-
33
-
34
-
35
-
36
-
37
-
 38
38 -
 39
39 -
 40
40 -
 41
41 -
 42
42 -
 43
43 -
 44
44 -
 45
45 -
 46
46 -
 47
47 -
 48
48 -
 49
49 -
 50
50 -
 51
51 -
 52
52 -
 53
53 -
 54
54 -
 55
55 -
 56
56 -
 57
57 -
 58
58 -
59
-
60
-
61
-
62
-
63
-
64
-
65
-
66
-
67
-
68
-
69
-
70
-
71
-
72
-
73
-
74
-
75
-
76
-
77
-
78
-
79
-
80
-
81
-
82
-
83
-
84
-
85
-
86
-
87
-
88
-
89
-
90
-
91
-
92
-
93
-
94
-
95
-
96
-
97
-
98
-
99
-
100
-
101
-
102
-
103
-
104
-
105
-
106
-
107
-
108
-
109
-
110
-
111
-
112
-
113
-
114
-
115
-
116
-
117
-
118
-
119
-
120
-
121
-
122
-
123
-
124
-
125
-
126
-
127
-
128
-
129
-
130
-
131
-
132
-
133
-
134
-
135
-
136
-
137
-
138
-
139
-
140
-
141
-
142
-
143
-
144
-
145
-
146
-
147
-
148
-
149
-
150
-
151
-
152
-
153
-
154
-
155
-
156
-
157
-
158
 |
 |

47
Management Discussion
International Business Machines Corporation and Subsidiary Companies
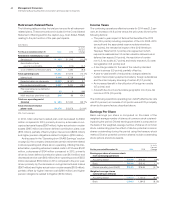
with diluted earnings per share of $5.51. The company generated
$6.1 billion in cash from operations and $6.6 billion in free cash flow
in the fourth quarter driving shareholder returns of $1.2 billion in
gross common stock repurchases and dividends.
The company’s results in the fourth quarter were impacted
by the dramatic strengthening of the U.S. dollar which began in
September and continued at a rapid pace. In addition, nearly all the
currencies moved in an unfavorable direction for the company’s
business profile and impacted revenue and earnings. Although the
company hedges a portion of its cross-border cash flows which
defers the impacts of currency movement, it does not eliminate it.
The company’s hedges are designed to provide stability around
the receipt of cash, but there is no year-to-year benefit in the
income statement when a currency’s direction is sustained over
a longer period.
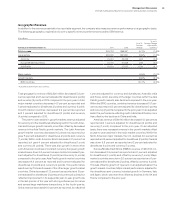
In the fourth quarter, total consolidated revenue decreased
11.9percent as reported and 2percent adjusted for currency
(5points) and the divestitures of the industry standard server and
customer care businesses (5points). These impacts represented
approximately $2.8 billion in revenue and a 10-point impact to
the year-to-year growth rate. In the fourth quarter, the company
continued its strong performance in its strategic imperatives
that address the market shifts in data, cloud and engagement.
Together they delivered double-digit growth, as they did in every
quarter during 2014.
Within the company’s segments, Global Services revenue
declined 7.8percent as reported, but was flat year to year adjusted
for currency (6points) and the divestitures (2points). Global
Technology Services revenue decreased 7.6percent as reported,
but increased 2percent adjusted for currency (6points) and the
divested businesses (4points) with growth across all business
lines. Global Business Services revenue decreased 8.4percent
(3percent adjusted for currency). Software revenue decreased
6.9percent (3percent adjusted for currency). Systems and
Technology revenue decreased 39.0percent as reported and
12percent adjusted for the industry standard server divestiture
(24points) and currency (3points), reflecting the end of the product
cycle in Systemz and declines in Power Systems and Storage.
From a geographic perspective, revenue in the major markets
declined 10.8percent as reported and 2percent adjusted for cur-
rency (5points) and the divestitures (4points). The growth markets
declined 15.7percent as reported and 2percent adjusted for the
divestitures (9points) and currency (5points) compared to the
fourth quarter of the prior year. Within the growth markets, the
BRIC countries decreased 21.4percent as reported and 8percent
adjusted for the divestitures (9points) and currency (4points).
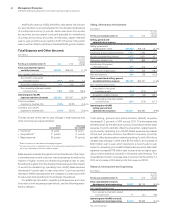
The consolidated gross profit margin increased 1.0points
versus the fourth quarter of 2013 to 53.3percent. The operating
(non-GAAP) gross margin of 53.9percent increased 0.6points
year to year driven primarily by improvements in GBS, and a mix
away from the low margin industry standard server business.
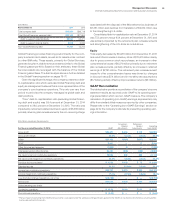
Total expense and other (income) decreased 20.3percent in
the fourth quarter of 2014 compared to the prior year. Total oper-
ating (non-GAAP) expense and other (income) also decreased
20.3percent year to year. The key drivers of the year-to-year
change in total expense and other (income) were approximately:
Total Operating
Consolidated (non-GAAP)
• Currency* (5) points (4) points
• Acquisitions** 1 points 1 points
• Base expense (17) points (17) points
* Reflects impacts of translation and hedging programs.
** Includes acquisitions completed in prior 12-month period; operating (non-GAAP) is
net of non-operating acquisition-related charges.
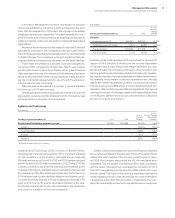
The reported level of expense in the fourth quarter reflected not
only the ongoing run rate of the business, but also the impact of
the industry standard server divestiture and a charge for workforce
rebalancing. The entire year-to-year decline was driven by the com-
bination of the gain on the divestiture and the fact that the expense
for the industry standard server business is no longer in the run
rate. Adjusting for this divestiture, total operating (non-GAAP)
expense and other (income) would have increased approximately
2percent (6percent adjusted for currency and acquisitions)
including the workforce rebalancing charge of approximately $580
million, nearly all of which was a year-to-year increase.
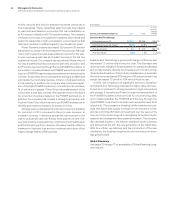
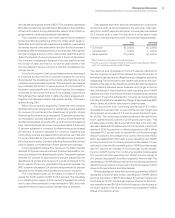
Pre-tax income from continuing operations of $7.1 billion
decreased 0.1percent year to year and the pre-tax margin was
29.4percent, an increase of 3.5points versus the fourth quar-
ter of 2013. The continuing operations effective tax rate for the
fourth quarter was 22.3percent, up 9.8points year to year. This
increase was primarily due to a benefit included in the prior year
rate associated with the settlement of a U.S. tax audit in the fourth
quarter of 2013. Income from continuing operations of $5.5 billion
decreased 11.3percent year to year and the net income margin
was 22.9percent, an increase of 0.2points. Net income of $5.5
billion decreased $701 million year to year. Operating (non-GAAP)
pre-tax income from continuing operations decreased 2.3per-
cent year to year and the operating (non-GAAP) pre-tax margin
was 30.7percent, an increase of 3.0points year to year. Operat-
ing (non-GAAP) income from continuing operations decreased
13.0percent and the operating (non-GAAP) income margin of
24.0percent decreased 0.3points compared to the prior year. The
operating (non-GAAP) effective tax rate from continuing operations
was 21.8percent versus 12.2percent in the fourth quarter of 2013
driven by the same factor described above.
Diluted earnings per share from continuing operations of $5.54
decreased 3.8percent year to year. Operating (non-GAAP) diluted
earnings per share of $5.81 decreased 5.7percent versus the
fourth quarter of 2013. Diluted earnings per share from discontin-
ued operations was ($0.03) in the fourth quarter of both years. In
the fourth quarter of 2014, the company repurchased 0.7 million
shares of its common stock.