IBM 2014 Annual Report Download - page 54
Download and view the complete annual report
Please find page 54 of the 2014 IBM annual report below. You can navigate through the pages in the report by either clicking on the pages listed below, or by using the keyword search tool below to find specific information within the annual report.-
 1
1 -
2
-
3
-
4
-
5
-
6
-
7
-
8
-
9
-
10
-
11
-
12
-
13
-
14
-
15
-
16
-
17
-
18
-
19
-
20
-
21
-
22
-
23
-
24
-
25
-
26
-
27
-
28
-
29
-
30
-
31
-
32
-
33
-
34
-
35
-
36
-
37
-
38
-
39
-
40
-
41
-
42
-
43
-
 44
44 -
 45
45 -
 46
46 -
 47
47 -
 48
48 -
 49
49 -
 50
50 -
 51
51 -
 52
52 -
 53
53 -
 54
54 -
 55
55 -
 56
56 -
 57
57 -
 58
58 -
 59
59 -
 60
60 -
 61
61 -
 62
62 -
 63
63 -
 64
64 -
65
-
66
-
67
-
68
-
69
-
70
-
71
-
72
-
73
-
74
-
75
-
76
-
77
-
78
-
79
-
80
-
81
-
82
-
83
-
84
-
85
-
86
-
87
-
88
-
89
-
90
-
91
-
92
-
93
-
94
-
95
-
96
-
97
-
98
-
99
-
100
-
101
-
102
-
103
-
104
-
105
-
106
-
107
-
108
-
109
-
110
-
111
-
112
-
113
-
114
-
115
-
116
-
117
-
118
-
119
-
120
-
121
-
122
-
123
-
124
-
125
-
126
-
127
-
128
-
129
-
130
-
131
-
132
-
133
-
134
-
135
-
136
-
137
-
138
-
139
-
140
-
141
-
142
-
143
-
144
-
145
-
146
-
147
-
148
-
149
-
150
-
151
-
152
-
153
-
154
-
155
-
156
-
157
-
158
 |
 |

53
Management Discussion
International Business Machines Corporation and Subsidiary Companies
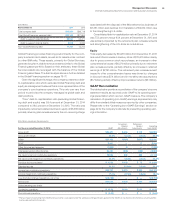
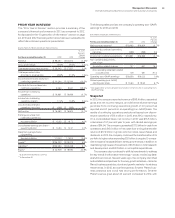
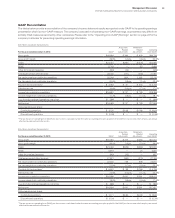
PRIOR YEAR IN REVIEW
The “Prior Year in Review” section provides a summary of the
company’s financial performance in 2013 as compared to 2012.
As discussed in the “Organization of Information” section on page
22, 2013 and 2012 financial performance has been reclassified to
reflect discontinued operations presentation.
($ and shares in millions except per share amounts)
For the year ended December 31: 2013 2012
Yr.-to-Yr.
Percent/
Margin
Change
Revenue $ 98,367 $102,874 (4.4)%*
Gross profit margin 49.5% 49.0% 0.5 pts.
Total expense and other (income) $ 28,440 $ 27,821 2.2%
Total expense and other
(income)-to-revenue ratio 28.9% 27.0%1.9 pts.
Income before income taxes from
continuing operations $ 20,244 $ 22,540 (10.2)%
Provision for income taxes from
continuing operations 3,363 5,541 (39.3)%
Income from continuing
operations $ 16,881 $ 16,999 (0.7)%
Income from continuing
operations margin 17.2% 16.5%0.6 pts.
Loss from discontinued
operations, net of tax $ (398) $ (395)0.6%
Net income $ 16,483 $ 16,604 (0.7)%
Earnings per share from
continuing operations:
Assuming dilution $ 15.30 $ 14.71 4.0%
Consolidated earnings per share—
assuming dilution $ 14.94 $ 14.37 4.0%
Weighted-average shares
outstanding:
Assuming dilution 1,103.0 1,155.4 (4.5)%
Assets** $126,223 $119,213 5.9%
Liabilities** $103,294 $100,229 3.1%
Equity** $ 22,929 $ 18,984 20.8%
* (2.3) percent adjusted for currency.
** At December31.
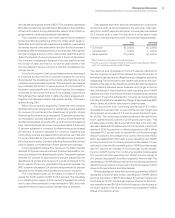
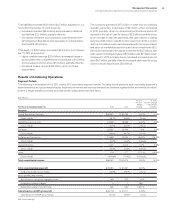
The following table provides the company’s operating (non-GAAP)
earnings for 2013 and 2012.
($ in millions except per share amounts)
For the year ended December 31: 2013 2012
Yr.-to-Yr.
Percent
Change
Net income as reported $16,483 $16,604 (0.7)%
Loss from discontinued operations,
net of tax (398) (395) 0.6
Income from continuing operations $16,881 $16,999 (0.7)%
Non-operating adjustments
(net of tax):
Acquisition-related charges 747 641 16.5
Non-operating retirement-related
costs/(income) 729 381 91.2
Operating (non-GAAP) earnings* $18,356 $18,022 1.9%
Diluted operating (non-GAAP)
earnings per share $ 16.64 $ 15.60 6.7%
*
See page 63 for a more detailed reconciliation of net income to operating (non-
GAAP earnings.
Snapshot
In 2013, the company reported revenue of $98.4 billion, expanded
gross and net income margins, and delivered diluted earnings
per share from continuing operations growth of 4.0percent as
reported and 6.7percent on an operating (non-GAAP) basis. The
results of continuing operations exclude net losses from discon-
tinued operations of $0.4 billion in 2013 and 2012, respectively.
On a consolidated basis, net income in 2013 was $16.5 billion,
a decrease of 0.7percent year to year, with diluted earnings per
share of $14.94. The company generated $17.5 billion in cash from
operations and $15.0 billion in free cash flow driving shareholder
returns of $17.9 billion in gross common stock repurchases and
dividends. In 2013, the company continued the transformation of its
portfolio to higher value expending $3.1 billion to acquire 10 compa-
nies to expand its capabilities in its key growth areas, in addition to
maintaining high levels of investment of $5.7 billion in total research
and development and $3.8 billion in net capital expenditures.
The company also continued to shift its investments to address
the key trends in information technology—social, mobile, big data/
analytics and cloud. Several years ago, the company identified
and established objectives for four key growth initiatives—Smarter
Planet, business analytics, cloud and growth markets—to address
these trends. In 2013, across the business, Smarter Planet, busi-
ness analytics and cloud had strong performance. Smarter
Planet revenue grew about 20percent compared to 2012, with