IBM 2014 Annual Report Download - page 128
Download and view the complete annual report
Please find page 128 of the 2014 IBM annual report below. You can navigate through the pages in the report by either clicking on the pages listed below, or by using the keyword search tool below to find specific information within the annual report.-
 1
1 -
2
-
3
-
4
-
5
-
6
-
7
-
8
-
9
-
10
-
11
-
12
-
13
-
14
-
15
-
16
-
17
-
18
-
19
-
20
-
21
-
22
-
23
-
24
-
25
-
26
-
27
-
28
-
29
-
30
-
31
-
32
-
33
-
34
-
35
-
36
-
37
-
38
-
39
-
40
-
41
-
42
-
43
-
44
-
45
-
46
-
47
-
48
-
49
-
50
-
51
-
52
-
53
-
54
-
55
-
56
-
57
-
58
-
59
-
60
-
61
-
62
-
63
-
64
-
65
-
66
-
67
-
68
-
69
-
70
-
71
-
72
-
73
-
74
-
75
-
76
-
77
-
78
-
79
-
80
-
81
-
82
-
83
-
84
-
85
-
86
-
87
-
88
-
89
-
90
-
91
-
92
-
93
-
94
-
95
-
96
-
97
-
98
-
99
-
100
-
101
-
102
-
103
-
104
-
105
-
106
-
107
-
108
-
109
-
110
-
111
-
112
-
113
-
114
-
115
-
116
-
117
-
 118
118 -
 119
119 -
 120
120 -
 121
121 -
 122
122 -
 123
123 -
 124
124 -
 125
125 -
 126
126 -
 127
127 -
 128
128 -
 129
129 -
 130
130 -
 131
131 -
 132
132 -
 133
133 -
 134
134 -
 135
135 -
 136
136 -
 137
137 -
 138
138 -
139
-
140
-
141
-
142
-
143
-
144
-
145
-
146
-
147
-
148
-
149
-
150
-
151
-
152
-
153
-
154
-
155
-
156
-
157
-
158
 |
 |

Notes to Consolidated Financial Statements
International Business Machines Corporation and Subsidiary Companies
127
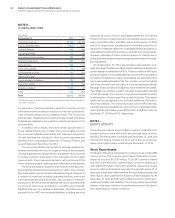
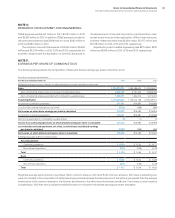
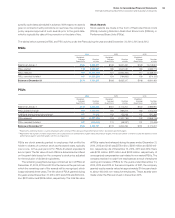
NOTE O.
RESEARCH, DEVELOPMENT AND ENGINEERING
RD&E expense was $5,437 million in 2014, $5,743 million in 2013
and $5,816 million in 2012. In addition, RD&E expense included in
discontinued operations was $368 million in 2014, $483 million in
2013 and $486 million in 2012.
The company incurred total expense of $5,595 million, $5,959
million and $6,034 million in 2014, 2013 and 2012, respectively, for
scientific research and the application of scientific advances to
the development of new and improved products and their uses,
as well as services and their application. Within these amounts,
software-related expense was $3,064 million, $3,077 million and
$3,078 million in 2014, 2013 and 2012, respectively.
Expense for product-related engineering was $211 million, $267
million and $268 million in 2014, 2013 and 2012, respectively.
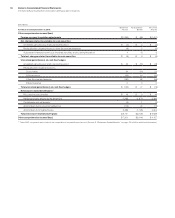
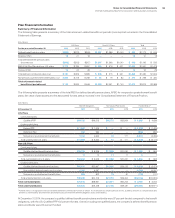
NOTE P.
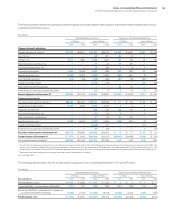
EARNINGS PER SHARE OF COMMON STOCK
The following table presents the computation of basic and diluted earnings per share of common stock.
($ in millions except per share amounts)
For the year ended December 31: 2014 2013 2012
Weighted-average number of shares on which earnings per share calculations are based
Basic 1,004,272,584 1,094,486,604 1,142,508,521
Add—incremental shares under stock-based compensation plans 4,332,155 6,751,240 10,868,426
Add—incremental shares associated with contingently issuable shares 1,395,741 1,804,313 2,072,370
Assuming dilution 1,010,000,480 1,103,042,156 1,155,449,317
Income from continuing operations $15,751 $16,881 $16,999
Loss from discontinued operations, net of tax (3,729) (398) (395)
Net income on which basic earnings per share is calculated $12,022 $16,483 $16,604
Income from continuing operations $15,751 $16,881 $16,999
Net income applicable to contingently issuable shares (3) (1) (1)
Income from continuing operations on which diluted earnings per share is calculated $15,749 $16,880 $16,998
Loss from discontinued operations, net of tax, on which basic and diluted earnings
per share is calculated (3,729) (398 ) (395 )
Net income on which diluted earnings per share is calculated $12,020 $16,483 $16,603
Earnings/(loss) per share of common stock
Assuming dilution
Continuing operations $ 15.59 $ 15.30 $ 14.71
Discontinued operations (3.69) (0.36) (0.34)
Total $ 11.90 $ 14.94 $ 14.37
Basic
Continuing operations $ 15.68 $ 15.42 $ 14.88
Discontinued operations (3.71) (0.36) (0.35)
Total $ 11.97 $ 15.06 $ 14.53
Weighted-average stock options to purchase 17,420 common shares in 2014 and 8,797 common shares in 2013 were outstanding, but
were not included in the computation of diluted earnings per share because the exercise price of the options was greater than the average
market price of the common shares for the full year, and therefore, the effect would have been antidilutive. There were no stock options
outstanding in 2012 that were considered antidilutive and not included in the diluted earnings per share calculation.