IBM 2014 Annual Report Download - page 135
Download and view the complete annual report
Please find page 135 of the 2014 IBM annual report below. You can navigate through the pages in the report by either clicking on the pages listed below, or by using the keyword search tool below to find specific information within the annual report.-
 1
1 -
2
-
3
-
4
-
5
-
6
-
7
-
8
-
9
-
10
-
11
-
12
-
13
-
14
-
15
-
16
-
17
-
18
-
19
-
20
-
21
-
22
-
23
-
24
-
25
-
26
-
27
-
28
-
29
-
30
-
31
-
32
-
33
-
34
-
35
-
36
-
37
-
38
-
39
-
40
-
41
-
42
-
43
-
44
-
45
-
46
-
47
-
48
-
49
-
50
-
51
-
52
-
53
-
54
-
55
-
56
-
57
-
58
-
59
-
60
-
61
-
62
-
63
-
64
-
65
-
66
-
67
-
68
-
69
-
70
-
71
-
72
-
73
-
74
-
75
-
76
-
77
-
78
-
79
-
80
-
81
-
82
-
83
-
84
-
85
-
86
-
87
-
88
-
89
-
90
-
91
-
92
-
93
-
94
-
95
-
96
-
97
-
98
-
99
-
100
-
101
-
102
-
103
-
104
-
105
-
106
-
107
-
108
-
109
-
110
-
111
-
112
-
113
-
114
-
115
-
116
-
117
-
118
-
119
-
120
-
121
-
122
-
123
-
124
-
 125
125 -
 126
126 -
 127
127 -
 128
128 -
 129
129 -
 130
130 -
 131
131 -
 132
132 -
 133
133 -
 134
134 -
 135
135 -
 136
136 -
 137
137 -
 138
138 -
 139
139 -
 140
140 -
 141
141 -
 142
142 -
 143
143 -
 144
144 -
 145
145 -
146
-
147
-
148
-
149
-
150
-
151
-
152
-
153
-
154
-
155
-
156
-
157
-
158
 |
 |

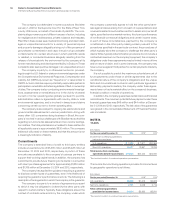
Notes to Consolidated Financial Statements
International Business Machines Corporation and Subsidiary Companies
134
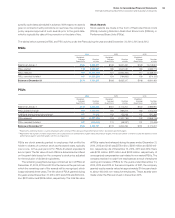
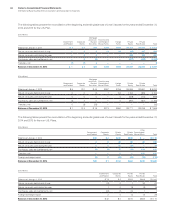
($ in millions)
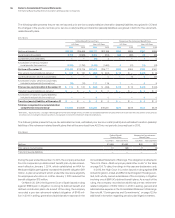
Defined Benefit Pension Plans
U.S. Plans Non-U.S. Plans
For the year ended December 31: 2014 2013 2012 2014 2013 2012
Service cost $ — $ — $ — $ 449 $ 501 $ 443
Interest cost 2,211 1,980 2,196 1,533 1,524 1,779
Expected return on plan assets (4,096) (3,981) (4,043) (2,247) (2,195) (2,303)
Amortization of transition assets —— — 00 0
Amortization of prior service costs/(credits) 10 10 10 (111) (119) (154)
Recognized actuarial losses 1,056 1,790 1,331 1,400 1,600 1,027
Curtailments and settlements —— — 26 0 0
Multi-employer plans/other costs* —— — 217 85 247
Total net periodic (income)/cost $ (818) $ (202) $ (507) $ 1,267 $ 1,396 $ 1,040
($ in millions)
Nonpension Postretirement Benefit Plans
U.S. Plan Non-U.S. Plans
For the year ended December 31: 2014 2013 2012 2014 2013 2012
Service cost $ 26 $ 35 $ 36 $ 7 $10 $14
Interest cost 187 164 200 63 60 64
Expected return on plan assets 0(1) — (9) (9) (9)
Amortization of transition assets —— — 00 0
Amortization of prior service costs/(credits) (7) — — (5) (5) (4)
Recognized actuarial losses 021 32 11 23 17
Curtailments and settlements —— — 00 0
Total net periodic cost $206 $218 $268 $66 $79 $82
* The 2014 Non-U.S. plans amount includes $148 million related to the IBM Spain pension litigation and the 2012 Non-U.S. plans amount includes $162 million related to the IBM UK
pension litigation. See page 136 for additional information.
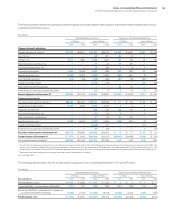
Defined Benefit Pension and Nonpension Postretirement
Benefit Plan Financial Information
The following tables through page 136 represent financial informa-
tion for the company’s retirement-related benefit plans, excluding
defined contribution plans. The defined benefit pension plans
under U.S. Plans consists of the Qualified PPP, the Excess PPP
and the Retention Plan. The defined benefit pension plans and the
nonpension postretirement benefit plans under Non-U.S. Plans
consists of all plans sponsored by the company’s subsidiaries. The
nonpension postretirement benefit plan under U.S. Plan consists
of only the U.S. Nonpension Postretirement Benefit Plan.
The tables below present the components of net periodic
(income)/cost of the retirement-related benefit plans recognized
in the Consolidated Statement of Earnings, excluding defined con-
tribution plans.