IBM 2014 Annual Report Download - page 42
Download and view the complete annual report
Please find page 42 of the 2014 IBM annual report below. You can navigate through the pages in the report by either clicking on the pages listed below, or by using the keyword search tool below to find specific information within the annual report.-
 1
1 -
2
-
3
-
4
-
5
-
6
-
7
-
8
-
9
-
10
-
11
-
12
-
13
-
14
-
15
-
16
-
17
-
18
-
19
-
20
-
21
-
22
-
23
-
24
-
25
-
26
-
27
-
28
-
29
-
30
-
31
-
 32
32 -
 33
33 -
 34
34 -
 35
35 -
 36
36 -
 37
37 -
 38
38 -
 39
39 -
 40
40 -
 41
41 -
 42
42 -
 43
43 -
 44
44 -
 45
45 -
 46
46 -
 47
47 -
 48
48 -
 49
49 -
 50
50 -
 51
51 -
 52
52 -
53
-
54
-
55
-
56
-
57
-
58
-
59
-
60
-
61
-
62
-
63
-
64
-
65
-
66
-
67
-
68
-
69
-
70
-
71
-
72
-
73
-
74
-
75
-
76
-
77
-
78
-
79
-
80
-
81
-
82
-
83
-
84
-
85
-
86
-
87
-
88
-
89
-
90
-
91
-
92
-
93
-
94
-
95
-
96
-
97
-
98
-
99
-
100
-
101
-
102
-
103
-
104
-
105
-
106
-
107
-
108
-
109
-
110
-
111
-
112
-
113
-
114
-
115
-
116
-
117
-
118
-
119
-
120
-
121
-
122
-
123
-
124
-
125
-
126
-
127
-
128
-
129
-
130
-
131
-
132
-
133
-
134
-
135
-
136
-
137
-
138
-
139
-
140
-
141
-
142
-
143
-
144
-
145
-
146
-
147
-
148
-
149
-
150
-
151
-
152
-
153
-
154
-
155
-
156
-
157
-
158
 |
 |

41
Management Discussion
International Business Machines Corporation and Subsidiary Companies
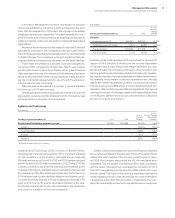
Research, development and engineering (RD&E) expense in
continuing operations was 5.9percent of revenue in 2014 and
5.8percent of revenue in 2013. RD&E expense decreased 5.3per-
cent in 2014 versus 2013 primarily driven by: lower base expense
(7points) and the effects of currency (1point), partially offset by
higher expense due to acquisitions (2points). Operating (non-
GAAP) RD&E expense decreased 3.0percent in 2014 compared to
the prior year, primarily driven by lower base expense (4points) and
the effects of currency (1point), partially offset by higher expense
due to acquisitions (2points).
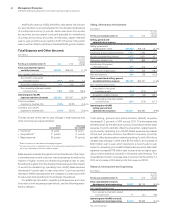
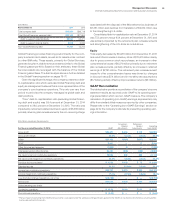
Intellectual Property and Custom Development Income
($ in millions)
For the year ended December 31: 2014 2013
Yr.-to-Yr.
Percent
Change
Sales and other transfers
of intellectual property $283 $352 (19.7)%
Licensing/royalty-based fees 129 150 (13.9)
Custom development income 330 320 3.1
Total $742 $822 (9.8)%
The timing and amount of Sales and other transfers of IP may vary
significantly from period to period depending upon the timing of
divestitures, economic conditions, industry consolidation and the
timing of new patents and know-how development. There were no
significant individual IP transactions in 2014 or 2013.
Other (Income) and Expense
($ in millions)
For the year ended December 31: 2014 2013
Yr.-to-Yr.
Percent
Change
Other (income) and expense
Foreign currency transaction
losses/(gains) $ (599) $(260) 130.4%
(Gains)/losses on derivative
instruments 654 166 293.3
Interest income (90) (74) 22.1
Net (gains)/losses from securities
and investment assets (26) (29) (11.5)
Other (1,878) (137) NM
Total consolidated other
(income) and expense $(1,938) $(333) 482.4%
Non-operating adjustment
Acquisition-related charges (1) (16) (94.7)
Operating (non-GAAP)
other (income) and expense $(1,939) $(349) 456.2%
NM—Not meaningful
The increase in income of $1,605 million year over year was pri-
marily driven by higher gains associated with divestitures ($1,710
million), driven by the industry standard server ($1,400 million) and
customer care ($202 million) transactions. Divestiture gains are
reflected in Other in the table above.
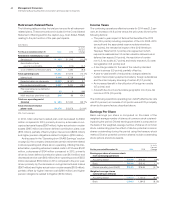
Interest Expense
($ in millions)
For the year ended December 31: 2014 2013
Yr.-to-Yr.
Percent
Change
Interest expense
Total $484 $402 20.4%
The increase in interest expense in 2014 versus 2013 was primar-
ily driven by higher average debt levels, partially offset by lower
average interest rates. Interest expense is presented in cost of
financing in the Consolidated Statement of Earnings only if the
related external borrowings are to support the Global Financing
external business. Overall interest expense (excluding capitalized
interest) in 2014 was $1,025 million, an increase of $36 million
year to year.
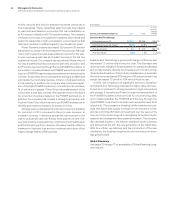
Stock-Based Compensation
Total pre-tax stock-based compensation cost of $512 million
decreased $102 million compared to 2013. The decrease was pri-
marily related to performance share units ($58 million), restricted
stock units ($26 million) and the company’s assumption of stock-
based awards previously issued by acquired entities ($18 million).
Stock-based compensation cost, and the year-to-year change,
was reflected in the following categories: Cost: $121 million, down
$1 million; SG&A expense: $350 million, down $85 million; RD&E
expense: $54 million, down $3 million and Other (income) and
expense: ($13 million), down $13 million. The amount of stock-
based compensation cost included in the loss from discontinued
operations, net of tax, was immaterial.