IBM 2014 Annual Report Download - page 49
Download and view the complete annual report
Please find page 49 of the 2014 IBM annual report below. You can navigate through the pages in the report by either clicking on the pages listed below, or by using the keyword search tool below to find specific information within the annual report.-
 1
1 -
2
-
3
-
4
-
5
-
6
-
7
-
8
-
9
-
10
-
11
-
12
-
13
-
14
-
15
-
16
-
17
-
18
-
19
-
20
-
21
-
22
-
23
-
24
-
25
-
26
-
27
-
28
-
29
-
30
-
31
-
32
-
33
-
34
-
35
-
36
-
37
-
38
-
 39
39 -
 40
40 -
 41
41 -
 42
42 -
 43
43 -
 44
44 -
 45
45 -
 46
46 -
 47
47 -
 48
48 -
 49
49 -
 50
50 -
 51
51 -
 52
52 -
 53
53 -
 54
54 -
 55
55 -
 56
56 -
 57
57 -
 58
58 -
 59
59 -
60
-
61
-
62
-
63
-
64
-
65
-
66
-
67
-
68
-
69
-
70
-
71
-
72
-
73
-
74
-
75
-
76
-
77
-
78
-
79
-
80
-
81
-
82
-
83
-
84
-
85
-
86
-
87
-
88
-
89
-
90
-
91
-
92
-
93
-
94
-
95
-
96
-
97
-
98
-
99
-
100
-
101
-
102
-
103
-
104
-
105
-
106
-
107
-
108
-
109
-
110
-
111
-
112
-
113
-
114
-
115
-
116
-
117
-
118
-
119
-
120
-
121
-
122
-
123
-
124
-
125
-
126
-
127
-
128
-
129
-
130
-
131
-
132
-
133
-
134
-
135
-
136
-
137
-
138
-
139
-
140
-
141
-
142
-
143
-
144
-
145
-
146
-
147
-
148
-
149
-
150
-
151
-
152
-
153
-
154
-
155
-
156
-
157
-
158
 |
 |

48 Management Discussion
International Business Machines Corporation and Subsidiary Companies
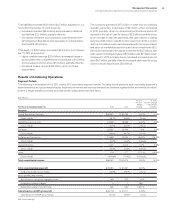
Results of Continuing Operations
Segment Details
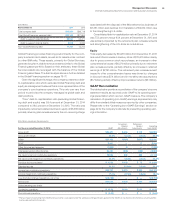
The following is an analysis of the fourth quarter of 2014 versus the fourth quarter of 2013 reportable segment external revenue and gross
margin results. Segment pre-tax income includes transactions between the segments that are intended to reflect an arms-length transfer
price and excludes certain unallocated corporate items.
($ in millions)
For the fourth quarter: 2014 2013
Yr.-to-Yr.
Percent/
Margin
Change
Yr.-to-Yr.
Percent Change
Adjusted for
Currency
Revenue
Global Technology Services $ 9,167 $ 9,917 (7.6)% 1.6%*
Gross margin 38.5% 38.8% (0.3) pts.
Global Business Services 4,349 4,747 (8.4)% (3.0)%
Gross margin 32.0% 30.7% 1.4 pts.
Software 7,578 8,140 (6.9)% (3.4)%
Gross margin 90.0% 90.5% (0.6) pts.
Systems and Technology 2,406 3,947 (39.0)% (12.2)%*
Gross margin 49.6% 42.2% 7.3 pts.
Global Financing 532 534 (0.5)% 4.6%
Gross margin 48.7% 43.3% 5.3 pts.
Other 82 100 (17.7)% (14.2)%
Gross margin (401.7)% (234.8)% (166.9) pts.
Total consolidated revenue $24,113 $27,385 (11.9)% (2.3)%*
Total consolidated gross profit $12,862 $14,337 (10.3)%
Total consolidated gross margin 53.3% 52.4% 1.0 pts.
Non-operating adjustments
Amortization of acquired intangible assets 101 103 (2.0)%
Acquisition-related charges —1 (100.0)%
Retirement-related costs/(income) 33 154 (78.8)%
Operating (non-GAAP) gross profit $12,996 $14,596 (11.0)%
Operating (non-GAAP) gross margin 53.9% 53.3% 0.6 pts.
* Adjusted for divestitures and currency.
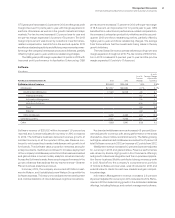
Global Services
In the fourth quarter of 2014, the Global Services segments, GTS
and GBS, delivered revenue of $13,516 million, a decrease of
7.8percent as reported, but flat year to year adjusted for currency
(6points) and the divested customer care and industry standard
server businesses (2points). Pre-tax income in the fourth quar-
ter decreased 25.0percent and the pre-tax margin decreased
3.5points to 15.9percent. Total outsourcing revenue of $6,042
million decreased 9.3percent as reported, but flat year to year
adjusted for currency (6points) and the divestitures (3points).
Total transactional revenue of $5,839 million decreased 5.9per-
cent (flat adjusted for currency).
Global Technology Services revenue of $9,167 million
decreased 7.6percent as reported, but increased 2percent
adjusted for currency (6points) and the divested businesses
(4points). Within GTS, outsourcing revenue of $5,109 million
decreased 9.6percent as reported, but increased 1percent
adjusted for currency (6points) and the divestitures (5points).
Clients are continuing to sign large outsourcing engagements
that leverage the company’s cloud, business analytics and mobile
solutions. Clients are using these outsourcing engagements as
a way to optimize their IT infrastructure while at the same time
enabling new services to their customers. Lufthansa and ABN
AMRO, both signings which were over $1 billion in contract