IBM 2014 Annual Report Download - page 40
Download and view the complete annual report
Please find page 40 of the 2014 IBM annual report below. You can navigate through the pages in the report by either clicking on the pages listed below, or by using the keyword search tool below to find specific information within the annual report.-
 1
1 -
2
-
3
-
4
-
5
-
6
-
7
-
8
-
9
-
10
-
11
-
12
-
13
-
14
-
15
-
16
-
17
-
18
-
19
-
20
-
21
-
22
-
23
-
24
-
25
-
26
-
27
-
28
-
29
-
 30
30 -
 31
31 -
 32
32 -
 33
33 -
 34
34 -
 35
35 -
 36
36 -
 37
37 -
 38
38 -
 39
39 -
 40
40 -
 41
41 -
 42
42 -
 43
43 -
 44
44 -
 45
45 -
 46
46 -
 47
47 -
 48
48 -
 49
49 -
 50
50 -
51
-
52
-
53
-
54
-
55
-
56
-
57
-
58
-
59
-
60
-
61
-
62
-
63
-
64
-
65
-
66
-
67
-
68
-
69
-
70
-
71
-
72
-
73
-
74
-
75
-
76
-
77
-
78
-
79
-
80
-
81
-
82
-
83
-
84
-
85
-
86
-
87
-
88
-
89
-
90
-
91
-
92
-
93
-
94
-
95
-
96
-
97
-
98
-
99
-
100
-
101
-
102
-
103
-
104
-
105
-
106
-
107
-
108
-
109
-
110
-
111
-
112
-
113
-
114
-
115
-
116
-
117
-
118
-
119
-
120
-
121
-
122
-
123
-
124
-
125
-
126
-
127
-
128
-
129
-
130
-
131
-
132
-
133
-
134
-
135
-
136
-
137
-
138
-
139
-
140
-
141
-
142
-
143
-
144
-
145
-
146
-
147
-
148
-
149
-
150
-
151
-
152
-
153
-
154
-
155
-
156
-
157
-
158
 |
 |

39
Management Discussion
International Business Machines Corporation and Subsidiary Companies
Total geographic revenue of $92,326 million decreased 5.6per-
cent as reported and 1percent adjusted for divestitures (2points)
and currency (2points) in 2014 compared to the prior year. In total,
major market countries decreased 4.3percent as reported and
1percent adjusted for divestitures (2points) and currency (1 point).
Growth market countries decreased 9.9percent as reported
and 3percent adjusted for divestitures (3points) and currency
(4points) compared to 2013.
The year-to-year decline in growth markets revenue adjusted
for currency and the divestitures reflected growth in the Latin Amer-
ican and Europe growth markets, more than offset by decreased
revenue in the Asia Pacific growth markets. The Latin American
growth market countries decreased 1.0percent as reported, but
grew 8percent adjusted for divestitures (2points) and currency
(7points). Within Latin America, Brazil decreased 3.1percent as
reported, but grew 4percent adjusted for divestitures (1point)
and currency (6points). There was also growth in most other
Latin American countries at constant currency. European growth
markets were down 5.3percent as reported, but increased 1per-
cent adjusted for divestitures (3points) and currency (3points)
compared to the prior year. Asia Pacific growth market countries
decreased 14.6percent as reported and 9percent adjusted for
divestitures (3points) and currency (2points). This performance
was driven by China and several of the other larger growth market
countries. China decreased 17.2percent as reported and 15per-
cent adjusted for divestitures (3points) and currency (0points), but
reflected improvement in its sequential year-to-year growth rate
in the last quarter of the year with strong software performance
and several large mainframe transactions. In the fourth quarter,
China revenue decreased 19.9percent as reported, but declined
1percent adjusted for currency and divestitures. Australia, India
and Korea, which are some of the larger countries within the Asia
Pacific growth markets, also declined compared to the prior year.
Within the BRIC countries, combined revenue decreased 10.7per-
cent as reported and 5percent adjusted for divestitures (3points)
and currency (3points) compared to the prior year. On an adjusted
basis, this performance reflects growth in Brazil and Russia, more
than offset by the declines in China and India.
Americas revenue of $41,410 million decreased 4.3percent as
reported and 1percent adjusted for divestitures (2points) and
currency (1point) compared to the prior year. On an adjusted
basis, there was increased revenue in the growth markets offset
by year-to-year declines in the major market countries. Within the
North American major markets, the U.S. declined 4.0percent as
reported and 2percent adjusted for divestitures (2points). Canada
was down 9.8percent as reported and 2percent adjusted for
divestitures (1point) and currency (7points).
Europe/Middle East/Africa (EMEA) revenue of $30,700 mil-
lion decreased 2.9percent as reported and 1percent adjusted
for divestitures (3points) and offset by currency (1point). Major
market countries were down 2.6percent as reported and 1per
-
cent adjusted for divestitures (2points), offset by currency (1point).
This was offset by growth of 1percent on an adjusted basis in the
growth market countries. Major market performance adjusted for
the divestitures and currency included growth in Germany, Italy
and Spain, which was more than offset by declines in the UK and
France compared to the prior year.
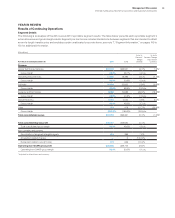
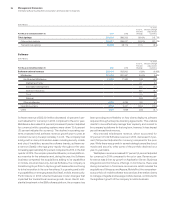
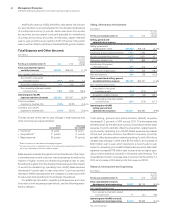
Geographic Revenue
In addition to the revenue presentation by reportable segment, the company also measures revenue performance on a geographic basis.
The following geographic, regional and country-specific revenue performance excludes OEM revenue.
($ in millions)
For the year ended December 31: 2014 2013
Yr.-to-Yr.
Percent
Change
Yr.-to-Yr.
Percent Change
Adjusted for
Currency*
Total revenue $92,793 $98,367 (5.7)% (1.5)%
Geographies $92,326 $97,800 (5.6)% (1.5)%
Americas 41,410 43,249 (4.3) (0.8)
Europe/Middle East/Africa 30,700 31,628 (2.9) (0.6)
Asia Pacific 20,216 22,923 (11.8) (4.1)
Major markets (4.3)% (1.0)%
Growth markets (9.9)% (3.2)%
BRIC countries (10.7)% (4.5)%
* Adjusted for divestitures and currency.