IBM 2014 Annual Report Download - page 139
Download and view the complete annual report
Please find page 139 of the 2014 IBM annual report below. You can navigate through the pages in the report by either clicking on the pages listed below, or by using the keyword search tool below to find specific information within the annual report.-
 1
1 -
2
-
3
-
4
-
5
-
6
-
7
-
8
-
9
-
10
-
11
-
12
-
13
-
14
-
15
-
16
-
17
-
18
-
19
-
20
-
21
-
22
-
23
-
24
-
25
-
26
-
27
-
28
-
29
-
30
-
31
-
32
-
33
-
34
-
35
-
36
-
37
-
38
-
39
-
40
-
41
-
42
-
43
-
44
-
45
-
46
-
47
-
48
-
49
-
50
-
51
-
52
-
53
-
54
-
55
-
56
-
57
-
58
-
59
-
60
-
61
-
62
-
63
-
64
-
65
-
66
-
67
-
68
-
69
-
70
-
71
-
72
-
73
-
74
-
75
-
76
-
77
-
78
-
79
-
80
-
81
-
82
-
83
-
84
-
85
-
86
-
87
-
88
-
89
-
90
-
91
-
92
-
93
-
94
-
95
-
96
-
97
-
98
-
99
-
100
-
101
-
102
-
103
-
104
-
105
-
106
-
107
-
108
-
109
-
110
-
111
-
112
-
113
-
114
-
115
-
116
-
117
-
118
-
119
-
120
-
121
-
122
-
123
-
124
-
125
-
126
-
127
-
128
-
 129
129 -
 130
130 -
 131
131 -
 132
132 -
 133
133 -
 134
134 -
 135
135 -
 136
136 -
 137
137 -
 138
138 -
 139
139 -
 140
140 -
 141
141 -
 142
142 -
 143
143 -
 144
144 -
 145
145 -
 146
146 -
 147
147 -
 148
148 -
 149
149 -
150
-
151
-
152
-
153
-
154
-
155
-
156
-
157
-
158
 |
 |
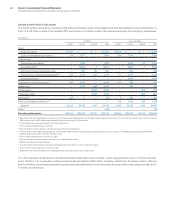
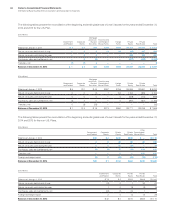
Notes to Consolidated Financial Statements
International Business Machines Corporation and Subsidiary Companies
138
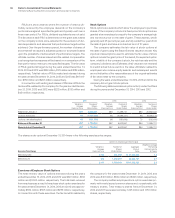
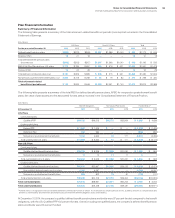
Expected Long-Term Returns on Plan Assets
Expected returns on plan assets, a component of net periodic
(income)/cost, represent the expected long-term returns on plan
assets based on the calculated market-related value of plan
assets. Expected long-term returns on plan assets take into
account long-term expectations for future returns and the invest-
ment policies and strategies as described on page 139. These
rates of return are developed by the company and are tested for
reasonableness against historical returns. The use of expected
long-term returns on plan assets may result in recognized pen-
sion income that is greater or less than the actual returns of those
plan assets in any given year. Over time, however, the expected
long-term returns are designed to approximate the actual long-
term returns, and therefore result in a pattern of income and cost
recognition that more closely matches the pattern of the services
provided by the employees. Differences between actual and
expected returns are recognized as a component of net loss or
gain in AOCI, which is amortized as a component of net periodic
(income)/cost over the service lives or life expectancy of the plan
participants, depending on the plan, provided such amounts
exceed certain thresholds provided by accounting standards. The
market-related value of plan assets recognizes changes in the fair
value of plan assets systematically over a five-year period in the
expected return on plan assets line in net periodic (income)/cost.
For the U.S. defined benefit pension plan, the Qualified PPP, the
expected long-term rate of return on plan assets of 8.00percent
remained constant for the years ended December 31, 2014, 2013
and 2012 and, consequently, had no incremental impact on net
periodic (income)/cost. For 2015, the projected long-term rate of
return on plan assets is approximately 7.5percent.
For the nonpension postretirement benefit plans, the company
maintains a highly liquid trust fund balance to ensure timely pay-
ments are made. As a result, for the years ended December 31,
2014, 2013 and 2012, the expected long-term return on plan assets
and the actual return on those assets were not material.
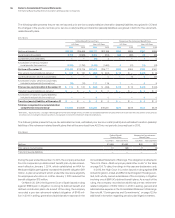
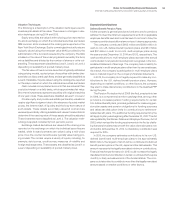
Rate of Compensation Increases and Mortality Rate
The rate of compensation increases is determined by the com
-
pany, based upon its long-term plans for such increases. The rate
of compensation increase is not applicable to the U.S. defined
benefit pension plans as benefit accruals ceased December 31,
2007 for all participants. Mortality rate assumptions are based on
life expectancy and death rates for different types of participants.
Mortality rates are periodically updated based on actual experi-
ence. In the U.S., the Society of Actuaries released new mortality
tables in 2014 which the company utilized in its plan remeasure-
ments at December 31, 2014. For the U.S. retirement-related
benefit plans, the change in mortality assumptions resulted in an
increase to the benefit obligations of approximately $2.6 billion.
Interest Crediting Rate
Benefits for certain participants in the PPP are calculated using a
cash balance formula. An assumption underlying this formula is an
interest crediting rate, which impacts both net periodic (income)/
cost and the PBO. This assumption provides a basis for projecting
the expected interest rate that participants will earn on the ben-
efits that they are expected to receive in the following year and is
based on the average from August to October of the one-year U.S.
Treasury Constant Maturity yield plus onepercent.
For the PPP, the change in the interest crediting rate to 1.1per-
cent for the year ended December 31, 2014, from 1.2percent for the
year ended December 31, 2013, resulted in an increase in 2014 net
periodic income of $8 million. The change in the interest crediting
rate to 1.2percent for the year ended December 31, 2013, from
1.1percent for the year ended December 31, 2012, resulted in a
decrease in 2013 net periodic income of $6 million. The change in
the interest crediting rate to 1.1percent for the year ended Decem-
ber 31, 2012, from 1.3percent for the year ended December 31, 2011,
resulted in an increase in 2012 net periodic income of $10 million.
Healthcare Cost Trend Rate
For nonpension postretirement benefit plan accounting, the
company reviews external data and its own historical trends for
healthcare costs to determine the healthcare cost trend rates.
However, the healthcare cost trend rate has an insignificant effect
on plan costs and obligations as a result of the terms of the plan
which limit the company’s obligation to the participants. The com-
pany assumes that the healthcare cost trend rate for 2015 will be
7percent. In addition, the company assumes that the same trend
rate will decrease to 5percent over the next four years. A one
percentage point increase or decrease in the assumed health
-
care cost trend rate would not have had a material effect on 2014,
2013 and 2012 net periodic cost or the benefit obligations as of
December 31, 2014 and 2013.
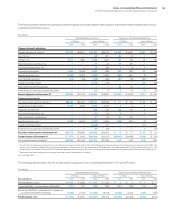
Plan Assets
Retirement-related benefit plan assets are recognized and mea-
sured at fair value. Because of the inherent uncertainty of valuations,
these fair value measurements may not necessarily reflect the
amounts the company could realize in current market transactions.