IBM 2014 Annual Report Download - page 55
Download and view the complete annual report
Please find page 55 of the 2014 IBM annual report below. You can navigate through the pages in the report by either clicking on the pages listed below, or by using the keyword search tool below to find specific information within the annual report.-
 1
1 -
2
-
3
-
4
-
5
-
6
-
7
-
8
-
9
-
10
-
11
-
12
-
13
-
14
-
15
-
16
-
17
-
18
-
19
-
20
-
21
-
22
-
23
-
24
-
25
-
26
-
27
-
28
-
29
-
30
-
31
-
32
-
33
-
34
-
35
-
36
-
37
-
38
-
39
-
40
-
41
-
42
-
43
-
44
-
 45
45 -
 46
46 -
 47
47 -
 48
48 -
 49
49 -
 50
50 -
 51
51 -
 52
52 -
 53
53 -
 54
54 -
 55
55 -
 56
56 -
 57
57 -
 58
58 -
 59
59 -
 60
60 -
 61
61 -
 62
62 -
 63
63 -
 64
64 -
 65
65 -
66
-
67
-
68
-
69
-
70
-
71
-
72
-
73
-
74
-
75
-
76
-
77
-
78
-
79
-
80
-
81
-
82
-
83
-
84
-
85
-
86
-
87
-
88
-
89
-
90
-
91
-
92
-
93
-
94
-
95
-
96
-
97
-
98
-
99
-
100
-
101
-
102
-
103
-
104
-
105
-
106
-
107
-
108
-
109
-
110
-
111
-
112
-
113
-
114
-
115
-
116
-
117
-
118
-
119
-
120
-
121
-
122
-
123
-
124
-
125
-
126
-
127
-
128
-
129
-
130
-
131
-
132
-
133
-
134
-
135
-
136
-
137
-
138
-
139
-
140
-
141
-
142
-
143
-
144
-
145
-
146
-
147
-
148
-
149
-
150
-
151
-
152
-
153
-
154
-
155
-
156
-
157
-
158
 |
 |

54 Management Discussion
International Business Machines Corporation and Subsidiary Companies
strength across all areas, including Smarter Commerce, Smarter
Cities, Social Business and industry solutions. Business analyt-
ics revenue of $15.7 billion increased 9percent year to year, led
by Global Business Services and Software. In 2013, the com-
pany delivered $4.4 billion of cloud-based solutions revenue, an
increase of 69percent compared to 2012. In addition, within that
content, $1.7 billion was delivered as a service. Across the com-
pany’s performance, there was overlap between these initiatives.
In total, software made up about half of that combined content.
The software content improved the company’s business mix and
contributed to margin expansion.
Segment revenue was led by Software which increased
1.9percent (3percent adjusted for currency) driven by key
branded middleware which increased 4.8percent (6percent
adjusted for currency). The key growth initiatives fueled this per-
formance. Global Business Services returned to revenue growth
at constant currency (down 0.9percent as reported; up 3per-
cent adjusted for currency) driven by the company’s investments
in the Digital Front Office. While revenue in Global Technology
Services declined 4.2percent (1percent adjusted for currency),
revenue trajectory improved in the second half. Global Financing
revenue improved 0.4percent (3percent adjusted for currency)
versus 2012. The Software, Global Services and Global Financing
businesses all grew pre-tax income and expanded their pre-
tax margin in 2013 compared to 2012. Systems and Technology
impacted the company’s overall performance in 2013. Revenue
decreased 19.0percent (18percent adjusted for currency) year
to year driven by the back end of the mainframe product cycle
and business model challenges specific to Power Systems, Stor-
age and Systemx. Pre-tax income in Systems and Technology
decreased $1.7 billion compared to 2012.
Revenue from the company’s growth markets underperformed
in 2013, particularly in the second half of the year. For the full year,
growth markets revenue decreased 4.9percent as reported and
2percent at constant currency.
The consolidated gross profit margin increased 0.5points
versus 2012 to 49.5percent. The operating (non-GAAP) gross
margin of 50.5percent increased 0.9points compared to the prior
year. The increase in gross margin in 2013 was driven by margin
improvements in the Global Services segments and an improved
mix driven by Software, partially offset by margin decreases in
Systems and Technology.
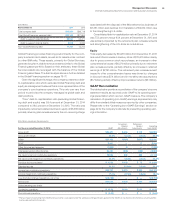
Total expense and other (income) increased 2.2percent in
2013 versus 2012. Total operating (non-GAAP) expense and other
(income) increased 1.5percent year to year. The year-to-year driv-
ers were approximately:
Total Operating
Consolidated (non-GAAP)
• Currency* (1) point (1) point
• Acquisitions** 2 points 2 points
• Base expense 1 point 1 point
* Reflects impacts of translation and hedging programs.
** Includes acquisitions completed in prior 12-month period.
There were several items that had an impact on total expense and
other (income) year to year. Workforce rebalancing charges for
2013 were $1.0 billion compared to $0.8 billion in 2012. Bad debt
expense increased $0.1 billion year to year driven by higher spe-
cific account reserves. In addition, in 2012, the company recorded
a gain of approximately $0.4 billion related to the divestiture of
the Retail Store Solutions (RSS) business, and also recorded a
charge of approximately $0.2 billion related to a court ruling in
the UK regarding one of IBM’s UK defined benefit pension plans.
This charge was not included in operating (non-GAAP) expense
and other (income). In addition, as a result of certain parts of the
business not performing as expected, performance-related com-
pensation in 2013 across both cost and expense was down about
$0.8 billion year to year.
Pre-tax income from continuing operations decreased
10.2percent and the pre-tax margin was 20.6percent, a decrease
of 1.3points versus 2012. The continuing operations effective tax
rate was 16.6percent in 2013, a decrease of 8.0points year to
year. Income from continuing operations decreased 0.7percent
year to year and the loss from discontinued operations, net of
tax was $0.4 billion in 2013 flat compared to 2012. Net income
decreased 0.7percent versus 2012. The as reported effective tax
rate for 2013 was 15.6percent, a decrease of 8.6points year to
year driven by an improvement in the ongoing tax rate and discrete
tax items, including audit settlements. Operating (non-GAAP) pre-
tax income decreased 7.2percent and the operating (non-GAAP)
pretax margin was 22.5percent, a decrease of 0.7points versus
2012. Operating (non-GAAP) net income increased 1.9percent
and the operating (non-GAAP) net income margin of 18.7percent
increased 1.2points versus the prior year. The operating (non-
GAAP) effective tax rate was 17.0percent versus 24.3percent in
2012 driven by the same factors described above.
Diluted earnings per share from continuing operations
improved 4.0percent year to year reflecting the benefits of the
common stock repurchase program. In 2013, the company repur-
chased approximately 73 million shares of its common stock.
Diluted earnings per share from discontinued operations was
($0.36) in 2013 compared to ($0.34) in 2012. Total diluted earn-
ings per share of $14.94 increased $0.57 from 2012. Operating
(non-GAAP) diluted earnings per share of $16.64 increased $1.04
versus 2012 driven primarily by margin expansion and common
stock repurchases, partially offset by decreased revenue.
At December31, 2013, the company’s balance sheet and
liquidity positions were strong and well positioned to support the
business over the long term. Cash and marketable securities at
year end was $11.1 billion, consistent with the year-end 2012 bal-
ance. Key drivers in the balance sheet and total cash flows are
highlighted below.
Total assets increased $7.0 billion ($9.3 billion adjusted for cur-
rency) from December31, 2012 driven by:
• Increases in prepaid pension assets ($4.6 billion), goodwill ($1.9
billion), and total receivables ($1.2 billion), partially offset by
• Decreases in deferred taxes ($0.7 billion).