IBM 2014 Annual Report Download - page 149
Download and view the complete annual report
Please find page 149 of the 2014 IBM annual report below. You can navigate through the pages in the report by either clicking on the pages listed below, or by using the keyword search tool below to find specific information within the annual report.-
 1
1 -
2
-
3
-
4
-
5
-
6
-
7
-
8
-
9
-
10
-
11
-
12
-
13
-
14
-
15
-
16
-
17
-
18
-
19
-
20
-
21
-
22
-
23
-
24
-
25
-
26
-
27
-
28
-
29
-
30
-
31
-
32
-
33
-
34
-
35
-
36
-
37
-
38
-
39
-
40
-
41
-
42
-
43
-
44
-
45
-
46
-
47
-
48
-
49
-
50
-
51
-
52
-
53
-
54
-
55
-
56
-
57
-
58
-
59
-
60
-
61
-
62
-
63
-
64
-
65
-
66
-
67
-
68
-
69
-
70
-
71
-
72
-
73
-
74
-
75
-
76
-
77
-
78
-
79
-
80
-
81
-
82
-
83
-
84
-
85
-
86
-
87
-
88
-
89
-
90
-
91
-
92
-
93
-
94
-
95
-
96
-
97
-
98
-
99
-
100
-
101
-
102
-
103
-
104
-
105
-
106
-
107
-
108
-
109
-
110
-
111
-
112
-
113
-
114
-
115
-
116
-
117
-
118
-
119
-
120
-
121
-
122
-
123
-
124
-
125
-
126
-
127
-
128
-
129
-
130
-
131
-
132
-
133
-
134
-
135
-
136
-
137
-
138
-
 139
139 -
 140
140 -
 141
141 -
 142
142 -
 143
143 -
 144
144 -
 145
145 -
 146
146 -
 147
147 -
 148
148 -
 149
149 -
 150
150 -
 151
151 -
 152
152 -
 153
153 -
 154
154 -
 155
155 -
 156
156 -
 157
157 -
 158
158
 |
 |

Notes to Consolidated Financial Statements
International Business Machines Corporation and Subsidiary Companies
148
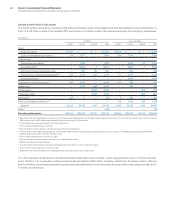
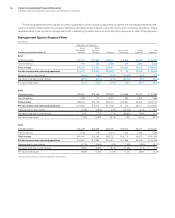
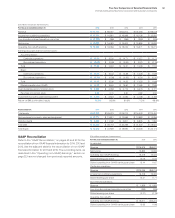
Management System Segment View
($ in millions)
Global Services Segments
For the year ended December 31:
Global
Technology
Services
Global
Business
Services Software
Systems and
Technology**
Global
Financing
Total
Segments**
2014
Assets $17,245 $7,795 $25,813 $4,235 $38,845 $93,933
Depreciation/amortization of intangibles* 1,873 58 1,210 712 455 4,308
Capital expenditures/investments in intangibles 2,272 33 534 600 482 3,921
Interest income — — — — 1,951 1,951
Interest expense — — — — 518 518
2013**
Assets $18,048 $8,311 $27,101 $4,901 $40,138 $98,499
Depreciation/amortization of intangibles* 1,670 72 1,211 435 574 3,963
Capital expenditures/investments in intangibles 1,938 69 540 395 467 3,410
Interest income — — — — 1,904 1,904
Interest expense — — — — 405 405
2012**
Assets $15,884 $8,022 $26,291 $5,092 $38,882 $94,170
Depreciation/amortization of intangibles* 1,597 75 1,157 404 853 4,088
Capital expenditures/investments in intangibles 1,760 42 618 517 708 3,644
Interest income — — — — 1,972 1,972
Interest expense — — — — 410 410
* Segment pre-tax income from continuing operations does not include the amortization of intangible assets.
** Reclassified to reflect discontinued operations presentation.