IBM 2014 Annual Report Download - page 58
Download and view the complete annual report
Please find page 58 of the 2014 IBM annual report below. You can navigate through the pages in the report by either clicking on the pages listed below, or by using the keyword search tool below to find specific information within the annual report.-
 1
1 -
2
-
3
-
4
-
5
-
6
-
7
-
8
-
9
-
10
-
11
-
12
-
13
-
14
-
15
-
16
-
17
-
18
-
19
-
20
-
21
-
22
-
23
-
24
-
25
-
26
-
27
-
28
-
29
-
30
-
31
-
32
-
33
-
34
-
35
-
36
-
37
-
38
-
39
-
40
-
41
-
42
-
43
-
44
-
45
-
46
-
47
-
 48
48 -
 49
49 -
 50
50 -
 51
51 -
 52
52 -
 53
53 -
 54
54 -
 55
55 -
 56
56 -
 57
57 -
 58
58 -
 59
59 -
 60
60 -
 61
61 -
 62
62 -
 63
63 -
 64
64 -
 65
65 -
 66
66 -
 67
67 -
 68
68 -
69
-
70
-
71
-
72
-
73
-
74
-
75
-
76
-
77
-
78
-
79
-
80
-
81
-
82
-
83
-
84
-
85
-
86
-
87
-
88
-
89
-
90
-
91
-
92
-
93
-
94
-
95
-
96
-
97
-
98
-
99
-
100
-
101
-
102
-
103
-
104
-
105
-
106
-
107
-
108
-
109
-
110
-
111
-
112
-
113
-
114
-
115
-
116
-
117
-
118
-
119
-
120
-
121
-
122
-
123
-
124
-
125
-
126
-
127
-
128
-
129
-
130
-
131
-
132
-
133
-
134
-
135
-
136
-
137
-
138
-
139
-
140
-
141
-
142
-
143
-
144
-
145
-
146
-
147
-
148
-
149
-
150
-
151
-
152
-
153
-
154
-
155
-
156
-
157
-
158
 |
 |

57
Management Discussion
International Business Machines Corporation and Subsidiary Companies
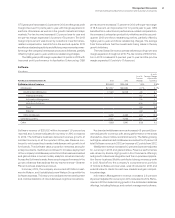
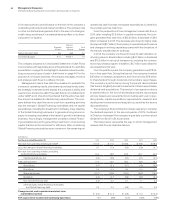
Software
($ in millions)
For the year ended December 31: 2013 2012
Yr.-to-Yr.
Percent
Change
Yr.-to-Yr.
Percent Change
Adjusted for
Currency
Software external revenue $25,932 $25,448 1.9% 2.9%
Middleware $21,557 $20,983 2.7% 3.7%
Key Branded Middleware 17,322 16,528 4.8 5.7
WebSphere Family 8.2 9.1
Information Management 2.8 3.7
Workforce Solutions 10.8 11.9
Tivoli 3.9 4.8
Rational 4.9 6.0
Other middleware 4,235 4,455 (4.9) (3.9)
Operating systems 2,447 2,525 (3.1) (1.9)
Other 1,929 1,940 (0.6) 0.2
Software revenue of $25,932 million increased 1.9percent as
reported and 3percent adjusted for currency in 2013 compared
to 2012. The Software business delivered revenue growth, at
constant currency, in all four quarters of the year. Revenue con
-
tinued to mix toward key branded middleware with growth in all
five brands. The Software value proposition remained strong for
enterprise clients. Customers continued to increase deployment
of the company’s middleware products and the business invested
and gained share in social, mobile, analytics, cloud and security.
Across the Software brands, there was strong performance in the
growth initiatives that address the key market trends—Smarter
Planet, business analytics and cloud.
In January 2014, the company announced a $1 billion invest
-
ment in Watson, and it established a new Watson Group within the
Software business. This new unit is dedicated to the development
and commercialization of cloud-delivered cognitive innovations.
Key branded middleware revenue increased 4.8percent (6per-
cent adjusted for currency), with strong performance in the areas
of analytics, cloud, mobile, social and security. The faster-growing
and higher-value branded middleware accounted for 67percent of
total Software revenue in 2013, an increase of 2points from 2012.
WebSphere revenue increased 8.2percent (9percent adjusted
for currency) in 2013 and gained share. Revenue performance
was driven by double-digit growth in the Commerce offerings,
and growth in Business Integration and the on-premises Applica-
tion Server business. Mobile contributed strong revenue growth
in 2013. MobileFirst, the company’s comprehensive portfolio
of mobile software and services, was introduced in 2013 and
extends value to clients to reach new markets and gain competi-
tive advantage.
Information Management revenue increased 2.8percent
(4percent adjusted for currency) in 2013 compared to 2012. Perfor-
mance in 2013 included strong growth in the distributed database
offerings, including Netezza, and content management software.
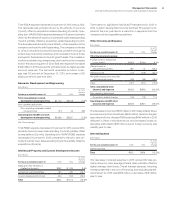
GTS gross profit decreased 0.3percent in 2013 and the gross profit
margin improved 1.5points year to year with margin expansion in
each line of business, as well as in the growth markets and major
markets. Pre-tax income increased 0.3percent year to year and
the pre-tax margin expanded 0.8points to 17.6percent. The 2013
margin improvement was driven by reductions in performance-
related compensation, benefits from the second-quarter 2013
workforce rebalancing activity and efficiency improvements primar-
ily through the company’s enterprise productivity initiatives, partially
offset by higher year-to-year workforce rebalancing charges.
The GBS gross profit margin expanded 0.9points in 2013 with
improved profit performance in Application Outsourcing. GBS
pre-tax income increased 7.7percent in 2013 with a pre-tax margin
of 16.8percent, an improvement of 1.3points year to year. GBS
benefited from reductions in performance-related compensation,
the company’s enterprise productivity initiatives and the second-
quarter 2013 workforce rebalancing activity, partially offset by
higher year-to-year workforce rebalancing charges. The savings
from those actions fuel the investments being made in the key
growth initiatives.
The total Global Services business delivered profit growth and
margin expansion throughout 2013. Pre-tax income of $10,197 mil-
lion in 2013 increased 2.5percent year to year and the pre-tax
margin expanded 1.0points to 17.4percent.