IBM 2014 Annual Report Download - page 147
Download and view the complete annual report
Please find page 147 of the 2014 IBM annual report below. You can navigate through the pages in the report by either clicking on the pages listed below, or by using the keyword search tool below to find specific information within the annual report.-
 1
1 -
2
-
3
-
4
-
5
-
6
-
7
-
8
-
9
-
10
-
11
-
12
-
13
-
14
-
15
-
16
-
17
-
18
-
19
-
20
-
21
-
22
-
23
-
24
-
25
-
26
-
27
-
28
-
29
-
30
-
31
-
32
-
33
-
34
-
35
-
36
-
37
-
38
-
39
-
40
-
41
-
42
-
43
-
44
-
45
-
46
-
47
-
48
-
49
-
50
-
51
-
52
-
53
-
54
-
55
-
56
-
57
-
58
-
59
-
60
-
61
-
62
-
63
-
64
-
65
-
66
-
67
-
68
-
69
-
70
-
71
-
72
-
73
-
74
-
75
-
76
-
77
-
78
-
79
-
80
-
81
-
82
-
83
-
84
-
85
-
86
-
87
-
88
-
89
-
90
-
91
-
92
-
93
-
94
-
95
-
96
-
97
-
98
-
99
-
100
-
101
-
102
-
103
-
104
-
105
-
106
-
107
-
108
-
109
-
110
-
111
-
112
-
113
-
114
-
115
-
116
-
117
-
118
-
119
-
120
-
121
-
122
-
123
-
124
-
125
-
126
-
127
-
128
-
129
-
130
-
131
-
132
-
133
-
134
-
135
-
136
-
 137
137 -
 138
138 -
 139
139 -
 140
140 -
 141
141 -
 142
142 -
 143
143 -
 144
144 -
 145
145 -
 146
146 -
 147
147 -
 148
148 -
 149
149 -
 150
150 -
 151
151 -
 152
152 -
 153
153 -
 154
154 -
 155
155 -
 156
156 -
 157
157 -
158
 |
 |

Notes to Consolidated Financial Statements
International Business Machines Corporation and Subsidiary Companies
146
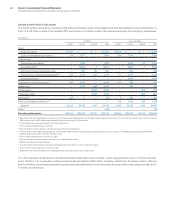
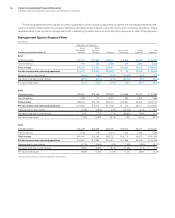
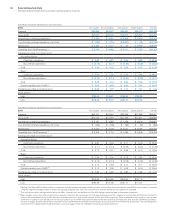
The following tables reflect the results of continuing operations of the company’s segments consistent with the management and mea-
surement system utilized within the company. Performance measurement is based on pre-tax income from continuing operations. These
results are used, in part, by senior management, both in evaluating the performance of, and in allocating resources to, each of the segments.
Management System Segment View
($ in millions)
Global Services Segments
For the year ended December 31:
Global
Technology
Services
Global
Business
Services Software
Systems and
Technology*
Global
Financing
Total
Segments*
2014
External revenue $37,130 $17,825 $25,434 $ 9,996 $2,034 $ 92,418
Internal revenue 934 543 3,496 647 2,488 8,108
Total revenue $38,063 $18,367 $28,931 $10,643 $4,522 $100,527
Pre-tax income from continuing operations $ 6,340 $ 2,999 $10,699 $ 34 $2,189 $ 22,262
Revenue year-to-year change (3.9)% (3.9)% (0.7)% (21.6)% 5.1% (4.9)%
Pre-tax income year-to-year change (9.2)% (6.7)% (3.7)% (84.1)% 0.8% (6.0)%
Pre-tax income margin 16.7% 16.3% 37.0% 0.3% 48.4% 22.1%
2013*
External revenue $38,551 $18,396 $25,932 $12,988 $2,022 $ 97,889
Internal revenue 1,063 714 3,191 593 2,282 7,843
Total revenue $39,615 $19,109 $29,123 $13,581 $4,304 $105,732
Pre-tax income from continuing operations $ 6,983 $ 3,214 $11,106 $ 213 $2,171 $ 23,687
Revenue year-to-year change (4.3)% (0.9)% 1.4% (18.7)% 5.7% (4.0)%
Pre-tax income year-to-year change 0.3% 7.7% 2.7% (88.6)% 6.8% (3.9)%
Pre-tax income margin 17.6% 16.8% 38.1% 1.6% 50.4% 22.4%
2012*
External revenue $40,236 $18,566 $25,448 $16,034 $2,013 $102,297
Internal revenue 1,166 719 3,274 676 2,060 7,896
Total revenue $41,402 $19,286 $28,722 $16,710 $4,073 $110,193
Pre-tax income from continuing operations $ 6,961 $ 2,983 $10,810 $ 1,866 $2,034 $ 24,653
Revenue year-to-year change (1.7)% (4.0)% 1.8% (7.0)% (2.9)% (2.1)%
Pre-tax income year-to-year change 10.8% (0.8)% 8.4% (11.6)% 1.1% 5.4%
Pre-tax income margin 16.8% 15.5% 37.6% 11.2% 49.9% 22.4%
* Reclassified to reflect discontinued operations presentation.