IBM 2014 Annual Report Download - page 44
Download and view the complete annual report
Please find page 44 of the 2014 IBM annual report below. You can navigate through the pages in the report by either clicking on the pages listed below, or by using the keyword search tool below to find specific information within the annual report.-
 1
1 -
2
-
3
-
4
-
5
-
6
-
7
-
8
-
9
-
10
-
11
-
12
-
13
-
14
-
15
-
16
-
17
-
18
-
19
-
20
-
21
-
22
-
23
-
24
-
25
-
26
-
27
-
28
-
29
-
30
-
31
-
32
-
33
-
 34
34 -
 35
35 -
 36
36 -
 37
37 -
 38
38 -
 39
39 -
 40
40 -
 41
41 -
 42
42 -
 43
43 -
 44
44 -
 45
45 -
 46
46 -
 47
47 -
 48
48 -
 49
49 -
 50
50 -
 51
51 -
 52
52 -
 53
53 -
 54
54 -
55
-
56
-
57
-
58
-
59
-
60
-
61
-
62
-
63
-
64
-
65
-
66
-
67
-
68
-
69
-
70
-
71
-
72
-
73
-
74
-
75
-
76
-
77
-
78
-
79
-
80
-
81
-
82
-
83
-
84
-
85
-
86
-
87
-
88
-
89
-
90
-
91
-
92
-
93
-
94
-
95
-
96
-
97
-
98
-
99
-
100
-
101
-
102
-
103
-
104
-
105
-
106
-
107
-
108
-
109
-
110
-
111
-
112
-
113
-
114
-
115
-
116
-
117
-
118
-
119
-
120
-
121
-
122
-
123
-
124
-
125
-
126
-
127
-
128
-
129
-
130
-
131
-
132
-
133
-
134
-
135
-
136
-
137
-
138
-
139
-
140
-
141
-
142
-
143
-
144
-
145
-
146
-
147
-
148
-
149
-
150
-
151
-
152
-
153
-
154
-
155
-
156
-
157
-
158
 |
 |

43
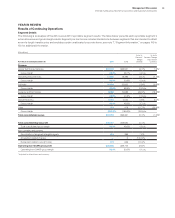
Management Discussion
International Business Machines Corporation and Subsidiary Companies
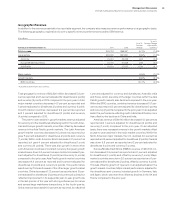
Actual shares outstanding at December31, 2014 and 2013 were
990.5 million and 1,054.4 million, respectively. The average number
of common shares outstanding assuming dilution was 93.0 million
shares lower in 2014 versus 2013. The decrease was primarily the
result of the common stock repurchase program.
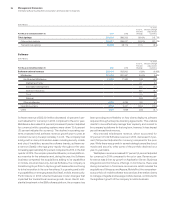
Results of Discontinued Operations
The loss from discontinued operations, net of tax, was $3.7 bil-
lion in 2014 and $0.4 billion in 2013. The loss in 2014 included a
non-recurring pre-tax charge of $4.7 billion, or $3.4 billion, net of
tax. The charge included an impairment to reflect the fair value
less estimated costs to sell the Microelectronics business, which
the company initially reported as held for sale at September30,
2014. The charge also included other estimated costs related
to the transaction, including cash consideration expected to be
transferred of approximately $1.5 billion. The cash consideration is
expected to be paid over the next three years and will be adjusted
down by the amount of the working capital due from GLOBAL-
FOUNDRIES, estimated to be $0.2 billion. In addition, discontinued
operations includes the operational net losses from the Microelec-
tronics business of $0.3 billion in 2014 and $0.4 billion in 2013. The
discontinued operations effective tax rate in 2014 was 30.2per-
cent compared to 44.8percent in 2013. The year-to-year decrease
in the rate was driven primarily by a one-time tax charge of $428
million in the third quarter of 2014 in connection with the disposal.
See noteC, “Acquisitions/Divestitures,” on pages 100 and 101
for additional information regarding the divestiture transaction.
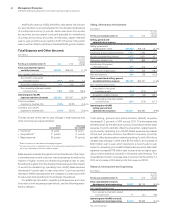
Financial Position
Dynamics
At December31, 2014, the company continued to have the finan-
cial flexibility to support the business over the long term. Cash and
marketable securities at year end were $8,476 million. During the
year, the company continued to manage the investment portfolio
to meet its capital preservation and liquidity objectives.
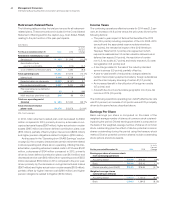
Total debt of $40,804 million increased $1,087 million from
prior year-end levels. The commercial paper balance at Decem-
ber31, 2014, was $650 million, a decrease of $1,808 million from
the prior year end. Within total debt, $29,103 million is in support
of the Global Financing business which is leveraged at a 7.2 to 1
ratio. The company continues to have substantial flexibility in the
market. During 2014, the company completed bond issuances
totaling $6,852 million, with terms ranging from 2 to 10years, and
interest rates ranging from 0.30 to 3.63percent depending on
maturity. The company has consistently generated strong cash
flow from operations and continues to have access to additional
sources of liquidity through the capital markets and its $10 billion
global credit facility, with 100percent of the facility available on a
same day basis.
Consistent with accounting standards, the company remea-
sures the funded status of its retirement and postretirement plans
at December31. At December31, 2014, the overall net under-
funded position was $16,932 million, an increase of $5,498 million
from December31, 2013 driven by a decrease in discount rates
and changes in U.S. mortality rate assumptions, partially offset
by strong asset returns worldwide. At year end, the company’s
qualified defined benefit plans were well funded and the cash
requirements related to these plans remain stable going forward
at approximately $600 million per year through 2019. In 2014, the
return on the U.S. Personal Pension Plan assets was 10.1percent
and the plan was 102percent funded at December 31. Overall,
global asset returns were 12.2percent and the qualified defined
benefit plans worldwide were 97percent funded at December 31.
During 2014, the company generated $16,868 million in cash
from operations, a decrease of $616 million compared to 2013. In
addition, the company generated $12,372 million in free cash flow,
a decrease of $2,649 million versus the prior year. See pages 66
to 67 for additional information on free cash flow. The company
returned $17,944 million to shareholders in 2014, with $13,679 mil-
lion in gross share repurchases and $4,265 million in dividends. In
2014, the company repurchased approximately 71.5 million shares
and had approximately $6.3 billion remaining in share repurchase
authorization at year end. The company’s cash generation permits
the company to invest and deploy capital to areas with the most
attractive long-term opportunities.
The assets and debt associated with the Global Financing
business are a significant part of the company’s financial posi-
tion. The financial position amounts appearing on page 82 are the
consolidated amounts including Global Financing. The amounts
appearing in the separate Global Financing section, beginning on
page 73, are supplementary data presented to facilitate an under-
standing of the Global Financing business.
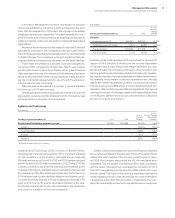
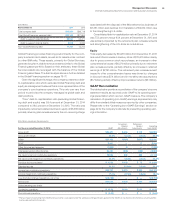
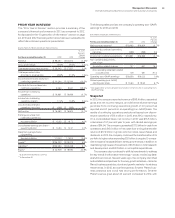
Working Capital
($ in millions)
At December 31: 2014 2013
Current assets $49,422 $51,350
Current liabilities 39,600 40,154
Working capital $ 9,822 $11,196
Current ratio 1.25:1 1.28:1
Working capital decreased $1,374 million from the year-end 2013
position. The key changes are described below:
Current assets decreased $1,928 million (an increase of $1,119
million adjusted for currency), as a result of:
• A decrease of $2,589 million in cash and cash equivalents
and marketable securities; and
• A decline of $1,375 million ($734 million adjusted for currency)
in trade receivables primarily due to the decline in revenue
and improved customer collections; partially offset by