IBM 2014 Annual Report Download - page 114
Download and view the complete annual report
Please find page 114 of the 2014 IBM annual report below. You can navigate through the pages in the report by either clicking on the pages listed below, or by using the keyword search tool below to find specific information within the annual report.-
 1
1 -
2
-
3
-
4
-
5
-
6
-
7
-
8
-
9
-
10
-
11
-
12
-
13
-
14
-
15
-
16
-
17
-
18
-
19
-
20
-
21
-
22
-
23
-
24
-
25
-
26
-
27
-
28
-
29
-
30
-
31
-
32
-
33
-
34
-
35
-
36
-
37
-
38
-
39
-
40
-
41
-
42
-
43
-
44
-
45
-
46
-
47
-
48
-
49
-
50
-
51
-
52
-
53
-
54
-
55
-
56
-
57
-
58
-
59
-
60
-
61
-
62
-
63
-
64
-
65
-
66
-
67
-
68
-
69
-
70
-
71
-
72
-
73
-
74
-
75
-
76
-
77
-
78
-
79
-
80
-
81
-
82
-
83
-
84
-
85
-
86
-
87
-
88
-
89
-
90
-
91
-
92
-
93
-
94
-
95
-
96
-
97
-
98
-
99
-
100
-
101
-
102
-
103
-
 104
104 -
 105
105 -
 106
106 -
 107
107 -
 108
108 -
 109
109 -
 110
110 -
 111
111 -
 112
112 -
 113
113 -
 114
114 -
 115
115 -
 116
116 -
 117
117 -
 118
118 -
 119
119 -
 120
120 -
 121
121 -
 122
122 -
 123
123 -
 124
124 -
125
-
126
-
127
-
128
-
129
-
130
-
131
-
132
-
133
-
134
-
135
-
136
-
137
-
138
-
139
-
140
-
141
-
142
-
143
-
144
-
145
-
146
-
147
-
148
-
149
-
150
-
151
-
152
-
153
-
154
-
155
-
156
-
157
-
158
 |
 |

Notes to Consolidated Financial Statements
International Business Machines Corporation and Subsidiary Companies
113
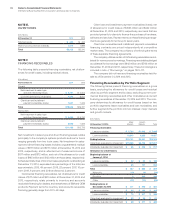
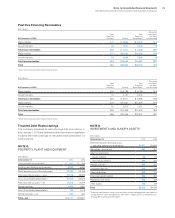
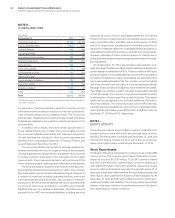
Past Due Financing Receivables
($ in millions)
At December 31, 2014:
Total
Past Due
> 90 Days*Current
Total
Financing
Receivables
Recorded
Investment
> 90 Days
and Accruing
Major markets $ 6 $ 5,696 $ 5,702 $ 6
Growth markets 32 1,911 1,943 14
Total lease receivables $38 $ 7,607 $ 7,645 $20
Major markets $ 9 $10,040 $10,049 $ 9
Growth markets 35 4,603 4,639 18
Total loan receivables $44 $14,643 $14,687 $27
Total $82 $22,250 $22,332 $47
* Does not include accounts that are fully reserved.
($ in millions)
At December 31, 2013:
Total
Past Due
> 90 Days*Current
Total
Financing
Receivables
Recorded
Investment
> 90 Days
and Accruing
Major markets $ 6 $ 6,789 $ 6,796 $ 5
Growth markets 19 2,181 2,200 11
Total lease receivables $25 $ 8,970 $ 8,996 $16
Major markets $ 9 $10,520 $10,529 $ 6
Growth markets 34 3,979 4,012 18
Total loan receivables $43 $14,499 $14,542 $25
Total $68 $23,469 $23,537 $41
* Does not include accounts that are fully reserved.
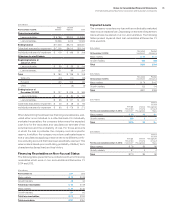
Troubled Debt Restructurings
The company assessed all restructurings that occurred on or
after January1, 2013 and determined that there were no significant
troubled debt restructurings for the years ended December31,
2013 and 2014.
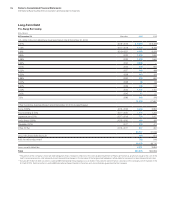
NOTE G.
PROPERTY, PLANT AND EQUIPMENT
($ in millions)
At December 31: 2014 2013
Land and land improvements $ 667 $ 706
Buildings and building improvements 9,524 9,680
Plant, laboratory and office equipment 27,388 28,169
Plant and other property—gross 37,578 38,555
Less: Accumulated depreciation 27,500 25,576
Plant and other property—net 10,078 12,979
Rental machines 1,456 1,920
Less: Accumulated depreciation 763 1,078
Rental machines—net 693 842
Total—net $10,771 $13,821
NOTE H.
INVESTMENTS AND SUNDRY ASSETS
($ in millions)
At December 31: 2014 2013
Deferred transition and setup costs
and other deferred arrangements* $1,527 $1,652
Derivatives—noncurrent 681 401
Alliance investments
Equity method 98 110
Non-equity method 496 200
Prepaid software 332 352
Long-term deposits 300 316
Other receivables 509 174
Employee benefit-related 356 392
Prepaid income taxes 518 305
Other assets 788 738
Total $5,603 $4,639
*
Deferred transition and setup costs and other deferred arrangements are related to
Global Services client arrangements. See noteA, “Significant Accounting Policies,”
on page 89 for additional information.