IBM 2012 Annual Report Download - page 74
Download and view the complete annual report
Please find page 74 of the 2012 IBM annual report below. You can navigate through the pages in the report by either clicking on the pages listed below, or by using the keyword search tool below to find specific information within the annual report.-
 1
1 -
2
-
3
-
4
-
5
-
6
-
7
-
8
-
9
-
10
-
11
-
12
-
13
-
14
-
15
-
16
-
17
-
18
-
19
-
20
-
21
-
22
-
23
-
24
-
25
-
26
-
27
-
28
-
29
-
30
-
31
-
32
-
33
-
34
-
35
-
36
-
37
-
38
-
39
-
40
-
41
-
42
-
43
-
44
-
45
-
46
-
47
-
48
-
49
-
50
-
51
-
52
-
53
-
54
-
55
-
56
-
57
-
58
-
59
-
60
-
61
-
62
-
63
-
 64
64 -
 65
65 -
 66
66 -
 67
67 -
 68
68 -
 69
69 -
 70
70 -
 71
71 -
 72
72 -
 73
73 -
 74
74 -
 75
75 -
 76
76 -
 77
77 -
 78
78 -
 79
79 -
 80
80 -
 81
81 -
 82
82 -
 83
83 -
 84
84 -
85
-
86
-
87
-
88
-
89
-
90
-
91
-
92
-
93
-
94
-
95
-
96
-
97
-
98
-
99
-
100
-
101
-
102
-
103
-
104
-
105
-
106
-
107
-
108
-
109
-
110
-
111
-
112
-
113
-
114
-
115
-
116
-
117
-
118
-
119
-
120
-
121
-
122
-
123
-
124
-
125
-
126
-
127
-
128
-
129
-
130
-
131
-
132
-
133
-
134
-
135
-
136
-
137
-
138
-
139
-
140
-
141
-
142
-
143
-
144
-
145
-
146
 |
 |

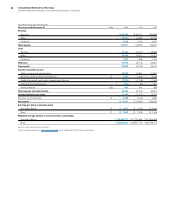
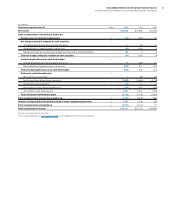
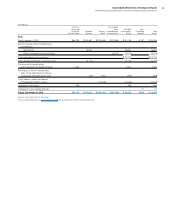
73
Consolidated Statement of Cash Flows
International Business Machines Corporation and Subsidiary Companies
($ in millions)
For the year ended December 31: 2012 2011 2010
Cash flows from operating activities
Net income $ 16,604 $ 15,855 $ 14,833
Adjustments to reconcile net income
to cash provided by operating activities
Depreciation 3,392 3,589 3,657
Amortization of intangibles 1,284 1,226 1,174
Stock-based compensation 688 697 629
Deferred taxes 797 1,212 1,294
Net (gain)/loss on asset sales and other (729)(342) (801)
Change in operating assets and liabilities, net of acquisitions/divestitures
Receivables (including financing receivables) (2,230)(1,279) (489)
Retirement related (1,008)(1,371) (1,963)
Inventories 280 (163) 92
Other assets/other liabilities 733 (28) 949
Accounts payable (224)451 174
Net cash provided by operating activities 19,586 19,846 19,549
Cash flows from investing activities
Payments for property, plant and equipment (4,082)(4,108) (4,185)
Proceeds from disposition of property, plant and equipment 410 608 770
Investment in software (635)(559) (569)
Purchases of marketable securities and other investments (4,109)(1,594) (6,129)
Proceeds from disposition of marketable securities and other investments 3,142 3,345 7,877
Non-operating finance receivables—net (608)(291) (405)
Acquisition of businesses, net of cash acquired (3,722)(1,811) (5,922)
Divestiture of businesses, net of cash transferred 599 14 55
Net cash used in investing activities (9,004)(4,396) (8,507)
Cash flows from financing activities
Proceeds from new debt 12,242 9,996 8,055
Payments to settle debt (9,549)(8,947) (6,522)
Short-term borrowings/(repayments) less than 90 days—net (441)1,321 817
Common stock repurchases (11,995)(15,046) (15,375)
Common stock transactions—other 1,540 2,453 3,774
Cash dividends paid (3,773)(3,473) (3,177)
Net cash used in financing activities (11,976)(13,696) (12,429)
Effect of exchange rate changes on cash and cash equivalents (116)(493) (135)
Net change in cash and cash equivalents (1,511)1,262 (1,522)
Cash and cash equivalents at January 1 11,922 10,661 12,183
Cash and cash equivalents at December 31 $ 10,412 $ 11,922 $ 10,661
Supplemental data
Income taxes paid—net of refunds received $ 3,169 $ 4,168 $ 3,238
Interest paid on debt $ 1,009 $ 956 $ 951
Capital lease obligations $ 10 $ 39 $ 30
Amounts may not add due to rounding.
The accompanying notes on pages 76 through 138 are an integral part of the financial statements.