IBM 2012 Annual Report Download - page 41
Download and view the complete annual report
Please find page 41 of the 2012 IBM annual report below. You can navigate through the pages in the report by either clicking on the pages listed below, or by using the keyword search tool below to find specific information within the annual report.-
 1
1 -
2
-
3
-
4
-
5
-
6
-
7
-
8
-
9
-
10
-
11
-
12
-
13
-
14
-
15
-
16
-
17
-
18
-
19
-
20
-
21
-
22
-
23
-
24
-
25
-
26
-
27
-
28
-
29
-
30
-
 31
31 -
 32
32 -
 33
33 -
 34
34 -
 35
35 -
 36
36 -
 37
37 -
 38
38 -
 39
39 -
 40
40 -
 41
41 -
 42
42 -
 43
43 -
 44
44 -
 45
45 -
 46
46 -
 47
47 -
 48
48 -
 49
49 -
 50
50 -
 51
51 -
52
-
53
-
54
-
55
-
56
-
57
-
58
-
59
-
60
-
61
-
62
-
63
-
64
-
65
-
66
-
67
-
68
-
69
-
70
-
71
-
72
-
73
-
74
-
75
-
76
-
77
-
78
-
79
-
80
-
81
-
82
-
83
-
84
-
85
-
86
-
87
-
88
-
89
-
90
-
91
-
92
-
93
-
94
-
95
-
96
-
97
-
98
-
99
-
100
-
101
-
102
-
103
-
104
-
105
-
106
-
107
-
108
-
109
-
110
-
111
-
112
-
113
-
114
-
115
-
116
-
117
-
118
-
119
-
120
-
121
-
122
-
123
-
124
-
125
-
126
-
127
-
128
-
129
-
130
-
131
-
132
-
133
-
134
-
135
-
136
-
137
-
138
-
139
-
140
-
141
-
142
-
143
-
144
-
145
-
146
 |
 |

4040 Management Discussion
International Business Machines Corporation and Subsidiary Companies
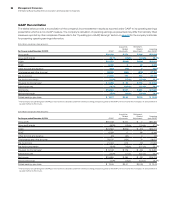
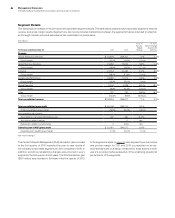
Segment Details
The following is an analysis of the fourth quarter of 2012 versus the fourth quarter of 2011 reportable segment external revenue and gross
margin results. Segment pre-tax income includes transactions between the segments that are intended to reflect an arms-length transfer
price and excludes certain unallocated corporate items.
($ in millions)
For the fourth quarter: 2012 2011
Yr.-to-Yr.
Percent/
Margin
Change
Yr.-to-Yr.
Percent Change
Adjusted for
Currency
Revenue
Global Technology Services $10,284 $10,452 (1.6)% (0.3)%
Gross margin 37.6% 36.6% 1.1 pts.
Global Business Services 4,720 4,877 (3.2)% (2.0)%
Gross margin 29.9% 29.3% 0.7 pts.
Software 7,915 7,648 3.5%4.2%
Gross margin 90.6% 89.8% 0.8 pts.
Systems and Technology 5,763 5,803 (0.7)% (0.6)%
Gross margin 44.1% 40.5% 3.6 pts.
Global Financing 535 548 (2.3)% (0.9)%
Gross margin 43.8% 49.7% (5.9) pts.
Other 87 159 (45.3)% (45.1)%
Gross margin (73.2)% (11.0)% (62.2) pts.
Total consolidated revenue $29,304 $29,486 (0.6)% 0.3%
Total consolidated gross profit $15,167 $14,722 3.0%
Total consolidated gross margin 51.8% 49.9% 1.8 pts.
Non-operating adjustments
Amortization of acquired intangible assets 99 81 22.4%
Acquisition-related charges 00 50.8
Retirement-related costs/(income) 60 (10)NM
Operating (non-GAAP) gross profit $15,327 $14,793 3.6%
Operating (non-GAAP) gross margin 52.3% 50.2% 2.1 pts.
NM—Not meaningful
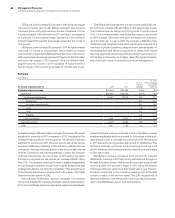
Global Services
The Global Services segments, Global Technology Services and
Global Business Services delivered $15,004 million of revenue in the
fourth quarter, a decrease of 2.1 percent (1 percent adjusted for cur-
rency) year to year. Overall revenue performance in the quarter was
led by the growth markets with revenue up 5.8 percent (7 percent
adjusted for currency). Total outsourcing revenue of $6,978 million
decreased 3.2 percent (2 percent adjusted for currency) and total
transactional revenue of $6,184 million decreased 1.0 percent (flat
adjusted for currency) year over year. Total Global Services pre-tax
income was $2,868 million, an increase of 3.5 percent year to
year. The combined pre-tax margin improved 1 point year to year
to 18.5 percent.
Global Technology Services revenue of $10,284 million decreased
1.6 percent as reported, but was flat on a constant currency basis in
the fourth quarter versus the same period in 2011. There were two
major factors within the major markets that impacted outsourcing
increase of 1.9 points compared to the prior year. The operating
(non-GAAP) effective tax rate was 24.4 percent, flat compared to
the fourth quarter of 2011.
Diluted earnings per share of $5.13 increased $0.51 or 11.0
percent from the fourth quarter of 2011. In the fourth quarter, the
company repurchased 15.4 million shares of its common stock.
Operating (non-GAAP) diluted earnings per share increased
14.4 percent reflecting the growth in operating (non-GAAP) net
income and the benefits of the common stock repurchase
program. Operating (non-GAAP) diluted earnings per share of
$5.39 increased $0.68 versus the fourth quarter of 2011 driven
by the following factors:
• Revenue decrease at actual rates $ (0.03)
• Margin expansion $ 0.47
• Common stock repurchases $ 0.24
Margin expansion was the largest contributor to the growth in
operating (non-GAAP) earnings per share in the fourth quarter. This
was achieved through a combination of gross margin improvements
and expense productivity.