IBM 2012 Annual Report Download - page 120
Download and view the complete annual report
Please find page 120 of the 2012 IBM annual report below. You can navigate through the pages in the report by either clicking on the pages listed below, or by using the keyword search tool below to find specific information within the annual report.-
 1
1 -
2
-
3
-
4
-
5
-
6
-
7
-
8
-
9
-
10
-
11
-
12
-
13
-
14
-
15
-
16
-
17
-
18
-
19
-
20
-
21
-
22
-
23
-
24
-
25
-
26
-
27
-
28
-
29
-
30
-
31
-
32
-
33
-
34
-
35
-
36
-
37
-
38
-
39
-
40
-
41
-
42
-
43
-
44
-
45
-
46
-
47
-
48
-
49
-
50
-
51
-
52
-
53
-
54
-
55
-
56
-
57
-
58
-
59
-
60
-
61
-
62
-
63
-
64
-
65
-
66
-
67
-
68
-
69
-
70
-
71
-
72
-
73
-
74
-
75
-
76
-
77
-
78
-
79
-
80
-
81
-
82
-
83
-
84
-
85
-
86
-
87
-
88
-
89
-
90
-
91
-
92
-
93
-
94
-
95
-
96
-
97
-
98
-
99
-
100
-
101
-
102
-
103
-
104
-
105
-
106
-
107
-
108
-
109
-
 110
110 -
 111
111 -
 112
112 -
 113
113 -
 114
114 -
 115
115 -
 116
116 -
 117
117 -
 118
118 -
 119
119 -
 120
120 -
 121
121 -
 122
122 -
 123
123 -
 124
124 -
 125
125 -
 126
126 -
 127
127 -
 128
128 -
 129
129 -
 130
130 -
131
-
132
-
133
-
134
-
135
-
136
-
137
-
138
-
139
-
140
-
141
-
142
-
143
-
144
-
145
-
146
 |
 |

Notes to Consolidated Financial Statements
International Business Machines Corporation and Subsidiary Companies
119
RSUs are stock awards granted to employees that entitle the holder
to shares of common stock as the award vests, typically over a
one- to five-year period. For RSUs awarded on or after January 1,
2008, dividend equivalents are not paid. The fair value of such RSUs
is determined and fixed on the grant date based on the company’s
stock price adjusted for the exclusion of dividend equivalents.
The remaining weighted-average contractual term of RSUs at
December 31, 2012, 2011 and 2010 is the same as the period over
which the remaining cost of the awards will be recognized, which
is approximately three years. The fair value of RSUs granted during
the years ended December 31, 2012, 2011 and 2010 was $486 mil-
lion, $803 million and $421 million, respectively. The total fair value
of RSUs vested and released during the years ended December 31,
2012, 2011 and 2010 was $509 million, $373 million and $503 mil-
lion, respectively. As of December 31, 2012, 2011 and 2010, there
was $938 million, $1,021 million and $865 million, respectively, of
unrecognized compensation cost related to non-vested RSUs. The
company received no cash from employees as a result of employee
vesting and release of RSUs for the years ended December 31,
2012, 2011 and 2010. In the second quarter of 2011, the company
granted equity awards valued at approximately $1 thousand each
to about 400,000 non-executive employees. These awards were
made under the Plans and vest in December 2015.
PSUs are stock awards where the number of shares ultimately
received by the employee depends on the company’s performance
against specified targets and typically vest over a three-year period.
For PSUs, dividend equivalents are not paid. The fair value of each
PSU is determined on the grant date, based on the company’s stock
price, adjusted for the exclusion of dividend equivalents, and
assumes that performance targets will be achieved. Over the per-
formance period, the number of shares of stock that will be issued
is adjusted upward or downward based upon the probability of
achievement of performance targets. The ultimate number of shares
issued and the related compensation cost recognized as expense
will be based on a comparison of the final performance metrics to
the specified targets. The fair value of PSUs granted at target during
the years ended December 31, 2012, 2011 and 2010 was $186
million, $165 million and $145 million, respectively. Total fair value of
PSUs vested and released during the years ended December 31,
2012, 2011 and 2010 was $203 million, $141 million and $153 million,
respectively.
In connection with vesting and release of RSUs and PSUs,
the tax benefits realized by the company for the years ended
December 31, 2012, 2011 and 2010 were $454 million, $283 million
and $293 million, respectively.
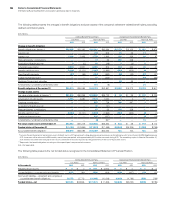
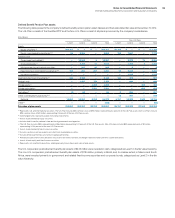
Stock Awards
In lieu of stock options, the company currently grants its employees stock awards. These awards are made in the form of Restricted Stock
Units (RSUs), including Retention Restricted Stock Units (RRSUs), or Performance Share Units (PSUs).
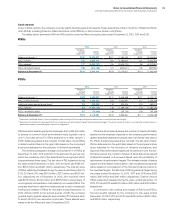
The tables below summarize RSU and PSU activity under the Plans during the years ended December 31, 2012, 2011 and 2010.
RSUs
2012 2011 2010
Weighted-
Average
Grant Price
Number
of Units
Weighted-
Average
Grant Price
Number
of Units
Weighted-
Average
Grant Price
Number
of Units
Balance at January 1 $129 12,218,601 $110 11,196,446 $102 13,405,654
RSUs granted 184 2,635,772 154 5,196,802 122 3,459,303
RSUs released 117 (4,338,787) 106 (3,508,700)98 (5,102,951)
RSUs canceled/forfeited 139 (674,125) 122 (665,947)105 (565,560)
Balance at December 31 $148 9,841,461 $129 12,218,601 $110 11,196,446
PSUs
2012 2011 2010
Weighted-
Average
Grant Price
Number
of Units
Weighted-
Average
Grant Price
Number
of Units
Weighted-
Average
Grant Price
Number
of Units
Balance at January 1 $122 3,686,991 $111 3,649,288 $107 3,476,737
PSUs granted at target 185 1,004,003 154 1,055,687 117 1,239,468
Additional shares earned above target* 102 550,399 118 230,524 103 463,913
PSUs released 102 (1,998,746) 118 (1,189,765)103 (1,486,484)
PSUs canceled/forfeited 131 (70,446) 118 (58,743)108 (44,346)
Balance at December 31** $151 3,172,201 $122 3,686,991 $111 3,649,288
* Represents additional shares issued to employees after vesting of PSUs because final performance metrics exceeded specified targets.
**
Represents the number of shares expected to be issued based on achievement of grant date performance targets. The actual number of shares issued depends on the company’s
performance against specified targets over the vesting period.