IBM 2012 Annual Report Download - page 12
Download and view the complete annual report
Please find page 12 of the 2012 IBM annual report below. You can navigate through the pages in the report by either clicking on the pages listed below, or by using the keyword search tool below to find specific information within the annual report.-
 1
1 -
 2
2 -
 3
3 -
 4
4 -
 5
5 -
 6
6 -
 7
7 -
 8
8 -
 9
9 -
 10
10 -
 11
11 -
 12
12 -
 13
13 -
 14
14 -
 15
15 -
 16
16 -
 17
17 -
 18
18 -
 19
19 -
 20
20 -
 21
21 -
 22
22 -
23
-
24
-
25
-
26
-
27
-
28
-
29
-
30
-
31
-
32
-
33
-
34
-
35
-
36
-
37
-
38
-
39
-
40
-
41
-
42
-
43
-
44
-
45
-
46
-
47
-
48
-
49
-
50
-
51
-
52
-
53
-
54
-
55
-
56
-
57
-
58
-
59
-
60
-
61
-
62
-
63
-
64
-
65
-
66
-
67
-
68
-
69
-
70
-
71
-
72
-
73
-
74
-
75
-
76
-
77
-
78
-
79
-
80
-
81
-
82
-
83
-
84
-
85
-
86
-
87
-
88
-
89
-
90
-
91
-
92
-
93
-
94
-
95
-
96
-
97
-
98
-
99
-
100
-
101
-
102
-
103
-
104
-
105
-
106
-
107
-
108
-
109
-
110
-
111
-
112
-
113
-
114
-
115
-
116
-
117
-
118
-
119
-
120
-
121
-
122
-
123
-
124
-
125
-
126
-
127
-
128
-
129
-
130
-
131
-
132
-
133
-
134
-
135
-
136
-
137
-
138
-
139
-
140
-
141
-
142
-
143
-
144
-
145
-
146
 |
 |
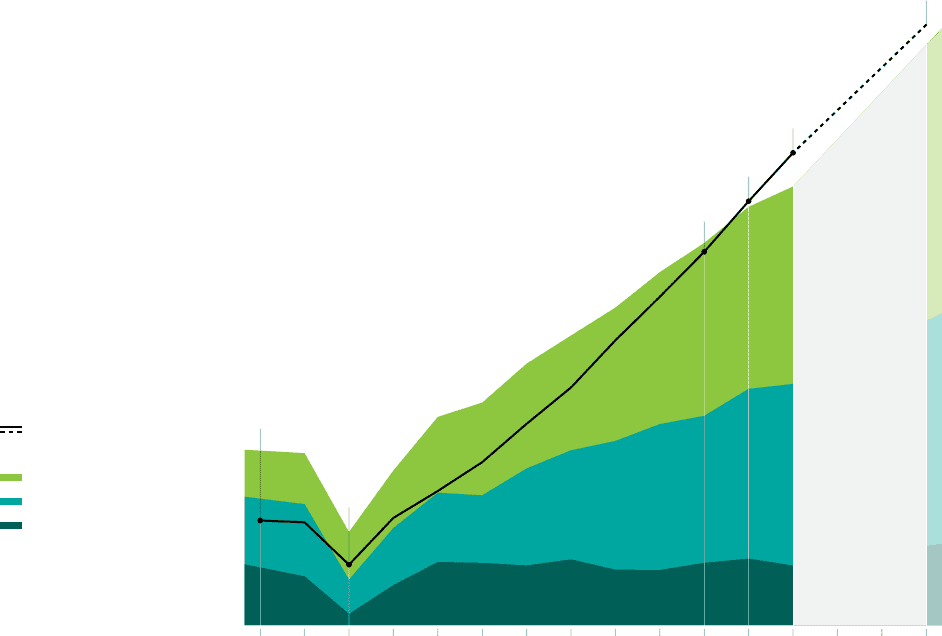
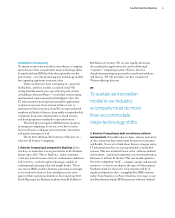
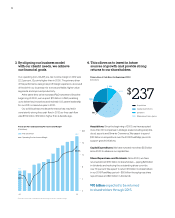
Our 2015 Road Map continues the drive to higher value—
with the expectation of at least $20 operating (non-GAAP)
EPS in 2015.
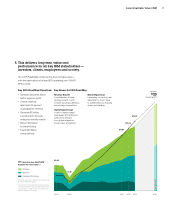
5. This delivers long-term value and
performance for all key IBM stakeholders —
investors, clients, employees and society.
* Excludes acquisition-related and nonoperating
retirement-related charges.
** 2000 and 2001 exclude Enterprise Investments
and not restated for stock-based compensation.
Sum of external segment pre-tax income not
equal to IBM pre-tax income.
• Software becomes about
half of segment profit
• Growth markets
approach 30 percent
of geographic revenue
• Generate $8 billion
in productivity through
enterprise transformation
• Return $70 billion
to shareholders
• Invest $20 billion
in acquisitions
2000 2002 2010 2011 2012 2015
$13.44
$15.25
$11.67
$3.32
$1.81
Services
Software
Hardware / Financing
Operating (non-GAAP) EPS*
Segment Pre-tax Income*, **
$
20
At Least
Operating EPS*
Revenue Growth
A combination of base
revenue growth, a shift
to faster growing businesses
and strategic acquisitions.
Share Repurchase
Leveraging our strong cash
generation to return value
to shareholders by reducing
shares outstanding.
Operating Leverage
A shift to higher-margin
businesses and enterprise
productivity derived
from global integration
and process efficiencies.
Key Drivers for 2015 Road MapKey 2015 Road Map Objectives:
11
Generating Higher Value at IBM