IBM 2012 Annual Report Download - page 49
Download and view the complete annual report
Please find page 49 of the 2012 IBM annual report below. You can navigate through the pages in the report by either clicking on the pages listed below, or by using the keyword search tool below to find specific information within the annual report.-
 1
1 -
2
-
3
-
4
-
5
-
6
-
7
-
8
-
9
-
10
-
11
-
12
-
13
-
14
-
15
-
16
-
17
-
18
-
19
-
20
-
21
-
22
-
23
-
24
-
25
-
26
-
27
-
28
-
29
-
30
-
31
-
32
-
33
-
34
-
35
-
36
-
37
-
38
-
 39
39 -
 40
40 -
 41
41 -
 42
42 -
 43
43 -
 44
44 -
 45
45 -
 46
46 -
 47
47 -
 48
48 -
 49
49 -
 50
50 -
 51
51 -
 52
52 -
 53
53 -
 54
54 -
 55
55 -
 56
56 -
 57
57 -
 58
58 -
 59
59 -
60
-
61
-
62
-
63
-
64
-
65
-
66
-
67
-
68
-
69
-
70
-
71
-
72
-
73
-
74
-
75
-
76
-
77
-
78
-
79
-
80
-
81
-
82
-
83
-
84
-
85
-
86
-
87
-
88
-
89
-
90
-
91
-
92
-
93
-
94
-
95
-
96
-
97
-
98
-
99
-
100
-
101
-
102
-
103
-
104
-
105
-
106
-
107
-
108
-
109
-
110
-
111
-
112
-
113
-
114
-
115
-
116
-
117
-
118
-
119
-
120
-
121
-
122
-
123
-
124
-
125
-
126
-
127
-
128
-
129
-
130
-
131
-
132
-
133
-
134
-
135
-
136
-
137
-
138
-
139
-
140
-
141
-
142
-
143
-
144
-
145
-
146
 |
 |

4848 Management Discussion
International Business Machines Corporation and Subsidiary Companies
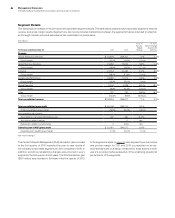
GTS gross profit increased 8.5 percent in 2011 and gross margin
improved 0.5 points year to year. Margin expansion was driven by
improved gross profit performance in all lines of business. Pre-tax
income increased to $6,284 million in 2011 with a pre-tax margin of
14.9 percent. On a normalized basis, segment pre-tax income in
2011 increased 10.9 percent and margin expanded 0.6 points to
15.2 percent.
GBS gross profit increased 8.6 percent in 2011 and gross margin
improved 0.7 points to 28.8 percent, led primarily by margin
improvement in Application Management Services Outsourcing.
GBS segment pre-tax income improved 18.1 percent to $3,006 million
with a pre-tax margin of 15.0 percent. On a normalized basis,
segment pre-tax income in 2011 increased 14.1 percent with a
pre-tax margin of 15.2 percent, an increase of 1.1 points year to year.
Total Global Services segment pre-tax income was $9,290 mil-
lion in 2011, an increase of $1,246 million or 15.5 percent year to year.
The combined pre-tax margin in 2011 improved 1.2 points versus
2010. On a normalized basis, total Global Services pre-tax income
in 2011 increased 11.9 percent with a pre-tax margin of 15.2 percent,
up 0.8 points year to year. In 2011, the company established two
Global Services integration hubs which will drive the business to a
new level of global consistency, integration and standardization in
the development and delivery of solutions to clients. Both Global
Services segments had strong profit and margin performance in
2011 as they continued to mix to higher value offerings and markets,
and continued to focus on productivity and cost management.
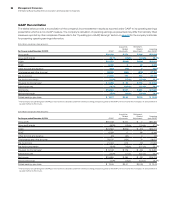
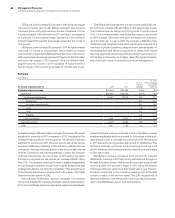
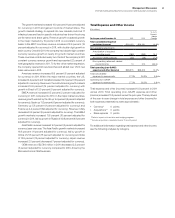
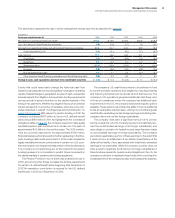
Software
($ in millions)
For the year ended December 31: 2011 2010
Yr.-to-Yr.
Percent
Change
Yr.-to-Yr.
Percent Change
Adjusted for
Currency
Software external revenue $24,944 $22,485 10.9% 8.0%
Middleware $20,650 $18,445 12.0% 9.0%
Key Branded Middleware 16,051 13,879 15.6 12.7
WebSphere 40.5 37.4
Information Management 12.5 9.6
Lotus 3.8 0.2
Tivoli 10.2 7.4
Rational 4.9 1.8
Other middleware 4,600 4,565 0.8 (1.9)
Operating systems 2,479 2,282 8.6 5.6
Other 1,814 1,758 3.2 0.4
Software revenue of $24,944 million increased 10.9 percent (8 percent
adjusted for currency) in 2011 compared to 2010. Adjusting for the
divested PLM operations, revenue grew at 11.8 percent (9 percent
adjusted for currency) in 2011. Revenue growth was driven by key
branded middleware, reflecting continued strong demand for the
company’s offerings and solid growth in key focus areas such as
Smarter Commerce and business analytics. Overall, the Software
business had another very good year in 2011, delivering nearly
$10 billion in segment pre-tax income, an increase of $500 million
from 2010. The company continued to invest in additional capabilities
for the Software business through both organic investments and
strategic acquisitions, including the completion of five acquisitions in
2011, plus acquisitions announced in the fourth quarter of 2011 that
closed in the first quarter of 2012.
Key branded middleware revenue increased 15.6 percent
(13 percent adjusted for currency) and again gained market share in
2011, as the Software business extended its lead in the middleware
market. Software revenue continued to mix to the faster growing
branded middleware which accounted for 64 percent of total soft-
ware revenue in 2011, an increase of 3 points from 2010. Performance
in 2011 was led by strong double-digit growth in WebSphere. The
Software business continued to have solid performance in its
growth initiatives, with business analytics revenue up double digits
in 2011 year to year.
WebSphere revenue increased 40.5 percent (37 percent
adjusted for currency) in 2011 with strong performance throughout
the year and gained share. WebSphere’s five product areas all had
revenue growth of 18 percent or higher in 2011, led by the Smarter
Commerce offerings, which more than tripled year to year. This per-
formance contributed to the company’s overall growth in the retail
industry in each of the last two years. The 2010 acquisitions of
Sterling Commerce, Coremetrics and Unica Corporation all contrib-
uted to the WebSphere year-to-year performance.