IBM 2012 Annual Report Download - page 34
Download and view the complete annual report
Please find page 34 of the 2012 IBM annual report below. You can navigate through the pages in the report by either clicking on the pages listed below, or by using the keyword search tool below to find specific information within the annual report.-
 1
1 -
2
-
3
-
4
-
5
-
6
-
7
-
8
-
9
-
10
-
11
-
12
-
13
-
14
-
15
-
16
-
17
-
18
-
19
-
20
-
21
-
22
-
23
-
 24
24 -
 25
25 -
 26
26 -
 27
27 -
 28
28 -
 29
29 -
 30
30 -
 31
31 -
 32
32 -
 33
33 -
 34
34 -
 35
35 -
 36
36 -
 37
37 -
 38
38 -
 39
39 -
 40
40 -
 41
41 -
 42
42 -
 43
43 -
 44
44 -
45
-
46
-
47
-
48
-
49
-
50
-
51
-
52
-
53
-
54
-
55
-
56
-
57
-
58
-
59
-
60
-
61
-
62
-
63
-
64
-
65
-
66
-
67
-
68
-
69
-
70
-
71
-
72
-
73
-
74
-
75
-
76
-
77
-
78
-
79
-
80
-
81
-
82
-
83
-
84
-
85
-
86
-
87
-
88
-
89
-
90
-
91
-
92
-
93
-
94
-
95
-
96
-
97
-
98
-
99
-
100
-
101
-
102
-
103
-
104
-
105
-
106
-
107
-
108
-
109
-
110
-
111
-
112
-
113
-
114
-
115
-
116
-
117
-
118
-
119
-
120
-
121
-
122
-
123
-
124
-
125
-
126
-
127
-
128
-
129
-
130
-
131
-
132
-
133
-
134
-
135
-
136
-
137
-
138
-
139
-
140
-
141
-
142
-
143
-
144
-
145
-
146
 |
 |

33
Management Discussion
International Business Machines Corporation and Subsidiary Companies
Total expense and other (income) decreased 2.5 percent in 2012
versus 2011. Total operating (non-GAAP) expense and other (income)
decreased 3.9 percent versus the prior year. The key drivers of the
year-to-year change in total expense and other (income) were
approximately:
Total Operating
Consolidated (non-GAAP)
• Currency* (5) points (5) points
• Acquisitions** 3 points 2 points
• Base expense (0) points (2) points
* Reflects impacts of translation and hedging programs.
** Includes acquisitions completed in prior 12-month period.
In the execution of its strategy, the company continues to invest
in its growth initiatives, innovation and strategic acquisitions. The
company also has had an ongoing focus on increasing efficiency
and productivity across the business.
For additional information regarding total expense and other
income, see the following analyses by category.
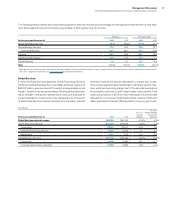
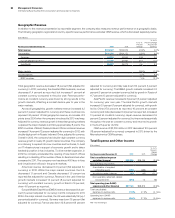
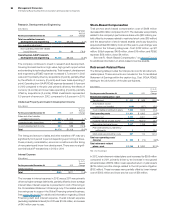
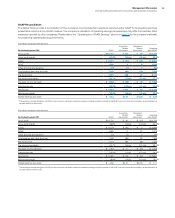
Selling, General and Administrative
($ in millions)
For the year ended December 31: 2012 2011
Yr.-to-Yr.
Percent
Change
Selling, general and
administrative expense
Selling, general and
administrative—other $19,589 $20,287 (3.4)%
Advertising and promotional expense 1,339 1,373 (2.5)
Workforce rebalancing charges 803 440 82.5
Retirement-related costs 945 603 56.7
Amortization of acquired
intangible assets 328 289 13.3
Stock-based compensation 498 514 (3.0)
Bad debt expense 50 88 (42.5)
Total consolidated selling, general
and administrative expense $23,553 $23,594 (0.2)%
Non-operating adjustments
Amortization of acquired
intangible assets (328) (289)13.3
Acquisition-related charges (22) (20)10.2
Non-operating retirement-related
(costs)/income (294) (13) NM
Operating (non-GAAP)
selling, general and
administrative expense $22,910 $23,272 (1.6)%
NM—Not meaningful
Total Selling, general and administrative (SG&A) expense decreased
0.2 percent in 2012 versus 2011. The decrease was primarily driven
by the effects of currency (3 points), partially offset by acquisition-
related spending (2 points), while base spending was essentially flat.
Operating (non-GAAP) SG&A expense decreased 1.6 percent pri-
marily driven by the effects of currency (3 points) and lower base
spending (1 point), partially offset by acquisition-related spending
(2 points). The increase in workforce rebalancing charges was due
to actions primarily focused on the company’s non-U.S. operations
in the third quarter of 2012. The increase in retirement-related costs
was primarily driven by the charge related to a court decision
regarding one of IBM UK’s defined benefit plans. As a result of the
ruling, the company recorded an additional retirement-related obli-
gation of $162 million in the third quarter of 2012. This charge is not
reflected in operating (non-GAAP) SG&A expense. See note M,
“Contingencies and Commitments,” on pages 110 through 112 for
additional information. Bad debt expense decreased $37 million in
2012 versus 2011, as the company increased its provisions in 2011
reflecting the European credit environment. The accounts receivable
provision coverage is 1.4 percent at December 31, 2012, a decrease
of 10 basis points from year-end 2011.
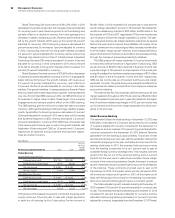
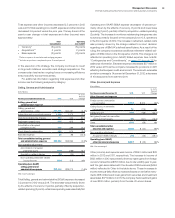
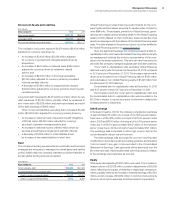
Other (Income) and Expense
($ in millions)
For the year ended December 31: 2012 2011
Yr.-to-Yr.
Percent
Change
Other (income) and expense
Foreign currency transaction
losses/(gains) $(240)$ 513 NM%
(Gains)/losses on derivative
instruments 72 (113) NM
Interest income (109)(136) (20.2)
Net (gains)/losses from securities
and investment assets (55)(227) (75.5)
Other (511)(58)NM
Total consolidated other
(income) and expense $(843)$ (20)NM%
Non-operating adjustment
Acquisition-related charges (13)(25)(46.0)
Operating (non-GAAP)
other (income) and expense $(857)$ (45)NM%
NM—Not meaningful
Other (income) and expense was income of $843 million and $20
million in 2012 and 2011, respectively. The increase in income of
$823 million in 2012 was primarily driven by higher gains from foreign
currency transactions ($753 million) due to rate volatility year to year,
and the gain associated with the divested RSS business ($446
million) reflected in Other in the table above. These increases in
income were partially offset by increased losses on derivative instru-
ments ($184 million) and lower gains from securities and investment
asset sales ($171 million). In 2011, the company had investment gains
of over $200 million, primarily from the sale of Lenovo shares.