IBM 2012 Annual Report Download - page 46
Download and view the complete annual report
Please find page 46 of the 2012 IBM annual report below. You can navigate through the pages in the report by either clicking on the pages listed below, or by using the keyword search tool below to find specific information within the annual report.-
 1
1 -
2
-
3
-
4
-
5
-
6
-
7
-
8
-
9
-
10
-
11
-
12
-
13
-
14
-
15
-
16
-
17
-
18
-
19
-
20
-
21
-
22
-
23
-
24
-
25
-
26
-
27
-
28
-
29
-
30
-
31
-
32
-
33
-
34
-
35
-
 36
36 -
 37
37 -
 38
38 -
 39
39 -
 40
40 -
 41
41 -
 42
42 -
 43
43 -
 44
44 -
 45
45 -
 46
46 -
 47
47 -
 48
48 -
 49
49 -
 50
50 -
 51
51 -
 52
52 -
 53
53 -
 54
54 -
 55
55 -
 56
56 -
57
-
58
-
59
-
60
-
61
-
62
-
63
-
64
-
65
-
66
-
67
-
68
-
69
-
70
-
71
-
72
-
73
-
74
-
75
-
76
-
77
-
78
-
79
-
80
-
81
-
82
-
83
-
84
-
85
-
86
-
87
-
88
-
89
-
90
-
91
-
92
-
93
-
94
-
95
-
96
-
97
-
98
-
99
-
100
-
101
-
102
-
103
-
104
-
105
-
106
-
107
-
108
-
109
-
110
-
111
-
112
-
113
-
114
-
115
-
116
-
117
-
118
-
119
-
120
-
121
-
122
-
123
-
124
-
125
-
126
-
127
-
128
-
129
-
130
-
131
-
132
-
133
-
134
-
135
-
136
-
137
-
138
-
139
-
140
-
141
-
142
-
143
-
144
-
145
-
146
 |
 |
45
Management Discussion
International Business Machines Corporation and Subsidiary Companies
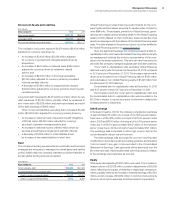
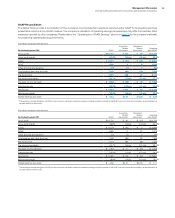
The consolidated gross profit margin increased 0.8 points versus
2010 to 46.9 percent. This was the eighth consecutive year of
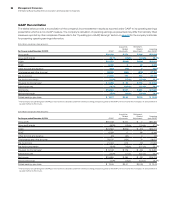
improvement in the gross profit margin. The operating (non-GAAP)
gross margin of 47.2 percent increased 1.1 points compared to the
prior year. The increase in gross margin in 2011 was driven by margin
improvements in Software, Systems and Technology and Global
Services, and an improved revenue mix driven by Software.
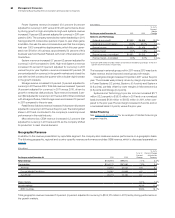
Total expense and other income increased 10.8 percent in 2011
versus the prior year. Total operating (non-GAAP) expense and other
income increased 10.2 percent compared to the prior year. The year-
to-year drivers for both categories were approximately:
• Currency* 4 points
• Acquisitions** 3 points
• Base expense 3 points
* Reflects impacts of translation and hedging programs.
** Includes acquisitions completed in prior 12-month period.
Pre-tax income grew 6.5 percent and the pre-tax margin was
19.6 percent, a decrease of 0.1 points versus 2010. Net income
increased 6.9 percent and the net income margin was 14.8 percent,
flat versus 2010. The effective tax rate for 2011 was 24.5 percent,
compared with 24.8 percent in the prior year. Operating (non-GAAP)
pre-tax income grew 8.7 percent and the operating (non-GAAP)
pre-tax margin was 20.2 percent, an increase of 0.3 points versus
the prior year. Operating (non-GAAP) earnings increased 8.6 percent
and the operating (non-GAAP) earnings margin of 15.3 percent
increased 0.2 points versus the prior year. The operating (non-GAAP)
effective tax rate was 24.5 percent versus 24.4 percent in 2010.
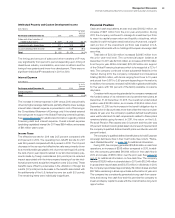
Diluted earnings per share improved 13.4 percent reflecting the
growth in net income and the benefits of the common stock repur-
chase program. In 2011, the company repurchased approximately 89
million shares of its common stock. Diluted earnings per share of
$13.06 increased $1.54 from the prior year. Operating (non-GAAP)
diluted earnings per share of $13.44 increased $1.77 versus 2010
driven by the following factors:
• Revenue increase at actual rates $0.82
• Margin expansion $0.18
• Common stock repurchases $0.77
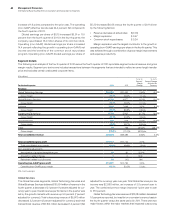
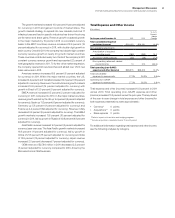
At December 31, 2011, the company’s balance sheet and liquidity
were well positioned to support the company’s objectives. Cash
and cash equivalents at year end was $11,922 million. Key drivers
in the balance sheet and total cash flows are highlighted below.
Total assets increased $2,981 million ($4,636 million adjusted for
currency) from December 31, 2010 driven by:
• Increases in total receivables ($1,564 million), cash and
cash equivalents ($1,262 million), goodwill ($1,077 million)
and prepaid expenses and other assets ($1,022 million),
partially offset by
• Decreases in marketable securities ($990 million) and
investments and sundry assets ($883 million).
Total liabilities increased $5,918 million ($6,324 million adjusted for
currency) from December 31, 2010 driven by:
• Increases in total debt ($2,695 million), retirement and
nonpension postretirement benefit obligations ($2,396 million),
accounts payable ($713 million) and deferred income
($798 million), partially offset by
• Decreases in taxes payable ($903 million).
Total equity of $20,236 million decreased $2,937 million from
December 31, 2010 as a result of:
• Increased treasury stock ($14,803 million) driven by
share repurchases, pension adjustments ($2,448 million)
and currency translation adjustments ($711 million),
partially offset by
• Higher retained earnings ($12,326 million) and common
stock ($2,711 million).
The company generated $19,846 million in cash flow from opera-
tions, an increase of $298 million compared to 2010, primarily driven
by the increase in net income. Net cash used in investing activities
of $4,396 million was $4,111 million lower than 2010, driven by less
cash used for acquisitions ($4,111 million). Net cash used in financing
activities of $13,696 million was $1,267 million higher, compared to
2010, primarily due to lower cash from common stock transactions
($991 million) and increased dividend payments ($296 million).