IBM 2012 Annual Report Download - page 125
Download and view the complete annual report
Please find page 125 of the 2012 IBM annual report below. You can navigate through the pages in the report by either clicking on the pages listed below, or by using the keyword search tool below to find specific information within the annual report.-
 1
1 -
2
-
3
-
4
-
5
-
6
-
7
-
8
-
9
-
10
-
11
-
12
-
13
-
14
-
15
-
16
-
17
-
18
-
19
-
20
-
21
-
22
-
23
-
24
-
25
-
26
-
27
-
28
-
29
-
30
-
31
-
32
-
33
-
34
-
35
-
36
-
37
-
38
-
39
-
40
-
41
-
42
-
43
-
44
-
45
-
46
-
47
-
48
-
49
-
50
-
51
-
52
-
53
-
54
-
55
-
56
-
57
-
58
-
59
-
60
-
61
-
62
-
63
-
64
-
65
-
66
-
67
-
68
-
69
-
70
-
71
-
72
-
73
-
74
-
75
-
76
-
77
-
78
-
79
-
80
-
81
-
82
-
83
-
84
-
85
-
86
-
87
-
88
-
89
-
90
-
91
-
92
-
93
-
94
-
95
-
96
-
97
-
98
-
99
-
100
-
101
-
102
-
103
-
104
-
105
-
106
-
107
-
108
-
109
-
110
-
111
-
112
-
113
-
114
-
 115
115 -
 116
116 -
 117
117 -
 118
118 -
 119
119 -
 120
120 -
 121
121 -
 122
122 -
 123
123 -
 124
124 -
 125
125 -
 126
126 -
 127
127 -
 128
128 -
 129
129 -
 130
130 -
 131
131 -
 132
132 -
 133
133 -
 134
134 -
 135
135 -
136
-
137
-
138
-
139
-
140
-
141
-
142
-
143
-
144
-
145
-
146
 |
 |

124 Notes to Consolidated Financial Statements
International Business Machines Corporation and Subsidiary Companies
124
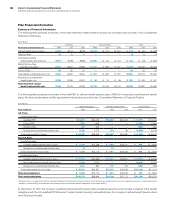
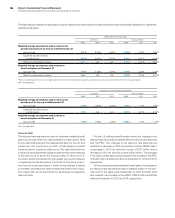
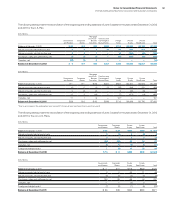
The following table presents the changes in benefit obligations and plan assets of the company’s retirement-related benefit plans, excluding
defined contribution plans.
($ in millions)
Defined Benefit Pension Plans Nonpension Postretirement Benefit Plans
U.S. Plans Non-U.S. Plans U.S. Plan Non-U.S. Plans
2012 2011 2012 2011 2012 2011 2012 2011
Change in benefit obligation
Benefit obligation at January 1 $54,085 $51,293 $ 42,861 $42,584 $ 5,273 $ 5,123 $ 901 $ 872
Service cost ——443 505 36 33 14 11
Interest cost 2,196 2,456 1,779 1,843 200 236 64 67
Plan participants’ contributions ——47 53 200 228 ——
Acquisitions/divestitures, net 0(0)26 (48)2(0)0(1)
Actuarial losses/(gains) 3,810 3,551 6,365 812 104 244 76 47
Benefits paid from trust (3,184) (3,121)(1,987) (1,995)(551) (623)(6) (7)
Direct benefit payments (97) (95)(454) (462)(35) (32)(27) (27)
Foreign exchange impact ——77 (423)——(24) (60)
Medicare/Government subsidies ————53 65 ——
Amendments/curtailments/settlements/other ——161 (8)——21 —
Benefit obligation at December 31 $56,810 $54,085 $ 49,319 $42,861 $ 5,282 $ 5,273 $1,019 $ 901
Change in plan assets
Fair value of plan assets at January 1 $51,218 $50,259 $ 35,362 $35,722 $ 38 $ 35 $ 112 $ 120
Actual return on plan assets 5,596 4,080 3,742 1,052 0010 13
Employer contributions ——557 728 746 397 10
Acquisitions/divestitures, net ——40 (27)———(0)
Plan participants’ contributions ——47 53 200 228 ——
Benefits paid from trust (3,184) (3,121)(1,987) (1,995)(551) (623)(6) (7)
Foreign exchange impact ——305 (537)——(8) (15)
Amendments/curtailments/settlements/other ——(8) 367* ——10 —
Fair value of plan assets at December 31 $53,630 $51,218 $ 38,058 $35,362 $ 433 $ 38 $ 119 $ 112
Funded status at December 31 $ (3,180) $ (2,866) $(11,261) $ (7,499) $(4,849) $(5,235)$ (900) $(789)
Accumulated benefit obligation** $56,810 $54,085 $ 48,369 $42,063 N/A N/A N/A N/A
*
Includes the reinstatement of certain plan assets in Brazil due to a 2011 government ruling allowing certain previously restricted plan assets to be returned to IBM. Beginning June
2011, the assets will be returned to IBM monthly over a three year period, with approximately $200 million returned during 2012. The remaining surplus in Brazil at December 31,
2012 remains excluded from total plan assets due to continued restrictions imposed by the government on the use of those plan assets.
** Represents the benefit obligation assuming no future participant compensation increases.
N/A—Not applicable
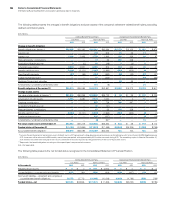
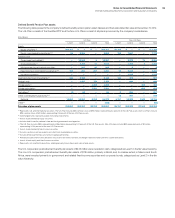
The following table presents the net funded status recognized in the Consolidated Statement of Financial Position.
($ in millions)
Defined Benefit Pension Plans Nonpension Postretirement Benefit Plans
U.S. Plans Non-U.S. Plans U.S. Plan Non-U.S. Plans
At December 31: 2012 2011 2012 2011 2012 2011 2012 2011
Prepaid pension assets $ 0 $ 0 $ 944 $ 2,843 $ 0 $ 0 $ 0 $ 0
Current liabilities—compensation and benefits (102) (96)(356) (304)(239) (437)(20) (22)
Noncurrent liabilities—retirement and nonpension
postretirement benefit obligations (3,078) (2,770) (11,849) (10,038)(4,610) (4,798)(880) (768)
Funded status—net $(3,180) $(2,866) $(11,261) $ (7,499)$(4,849) $(5,235)$(900) $(789)