IBM 2012 Annual Report Download - page 132
Download and view the complete annual report
Please find page 132 of the 2012 IBM annual report below. You can navigate through the pages in the report by either clicking on the pages listed below, or by using the keyword search tool below to find specific information within the annual report.-
 1
1 -
2
-
3
-
4
-
5
-
6
-
7
-
8
-
9
-
10
-
11
-
12
-
13
-
14
-
15
-
16
-
17
-
18
-
19
-
20
-
21
-
22
-
23
-
24
-
25
-
26
-
27
-
28
-
29
-
30
-
31
-
32
-
33
-
34
-
35
-
36
-
37
-
38
-
39
-
40
-
41
-
42
-
43
-
44
-
45
-
46
-
47
-
48
-
49
-
50
-
51
-
52
-
53
-
54
-
55
-
56
-
57
-
58
-
59
-
60
-
61
-
62
-
63
-
64
-
65
-
66
-
67
-
68
-
69
-
70
-
71
-
72
-
73
-
74
-
75
-
76
-
77
-
78
-
79
-
80
-
81
-
82
-
83
-
84
-
85
-
86
-
87
-
88
-
89
-
90
-
91
-
92
-
93
-
94
-
95
-
96
-
97
-
98
-
99
-
100
-
101
-
102
-
103
-
104
-
105
-
106
-
107
-
108
-
109
-
110
-
111
-
112
-
113
-
114
-
115
-
116
-
117
-
118
-
119
-
120
-
121
-
 122
122 -
 123
123 -
 124
124 -
 125
125 -
 126
126 -
 127
127 -
 128
128 -
 129
129 -
 130
130 -
 131
131 -
 132
132 -
 133
133 -
 134
134 -
 135
135 -
 136
136 -
 137
137 -
 138
138 -
 139
139 -
 140
140 -
 141
141 -
 142
142 -
143
-
144
-
145
-
146
 |
 |

Notes to Consolidated Financial Statements
International Business Machines Corporation and Subsidiary Companies
131
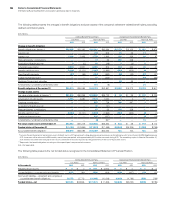
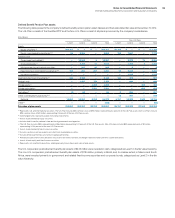
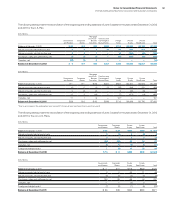
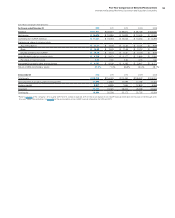
The following tables present the reconciliation of the beginning and ending balances of Level 3 assets for the years ended December 31, 2012
and 2011 for the U.S. Plan.
($ in millions)
Government
and Related
Corporate
Bonds
Mortgage
and Asset-
Backed
Securities
Fixed Income
Commingled/
Mutual Funds
Hedge
Funds
Private
Equity
Private
Real Estate To ta l
Balance at January 1, 2012 $ 29 $12 $45 $246 $713 $4,098 $2,790 $7,932
Return on assets held at end of year 0 0 1 21 56 855 202 1,135
Return on assets sold during the year 0 2 1 — 14 (334) (41) (359)
Purchases, sales and settlements, net (1) (2) (9) — (26) (533) (90) (660)
Transfers, net (22) (1) 8 — — — — (15)
Balance at December 31, 2012 $ 6 $11 $45 $267 $756 $4,085 $2,861 $8,032
($ in millions)
Government
and Related
Corporate
Bonds
Mortgage
and Asset-
Backed
Securities
Fixed Income
Commingled/
Mutual Funds
Hedge
Funds
Private
Equity
Private
Real Estate To ta l
Balance at January 1, 2011 $ — $ — $ 56 $221 $624 $4,251 $2,634 $7,786
Return on assets held at end of year (0) 0 (1) 25 (35) 348 131 468
Return on assets sold during the year 0 (0) (0) — 5 (30) 39 14
Purchases, sales and settlements, net 12 5 (16) — (7) (471) (14) (492)
Transfers, net 17 7 6 — 127* — — 157
Balance at December 31, 2011 $29 $12 $ 45 $246 $713 $4,098 $2,790 $7,932
* Due to an increase in the redemption term during 2011, the asset was transferred from Level 2 to Level 3.
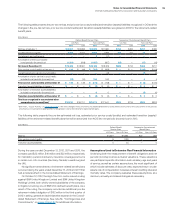
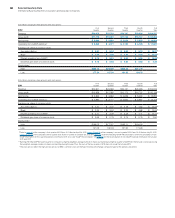
The following tables present the reconciliation of the beginning and ending balances of Level 3 assets for the years ended December 31, 2012
and 2011 for the non-U.S. Plans.
($ in millions)
Government
and Related
Corporate
Bonds
Private
Equity
Private
Real Estate To ta l
Balance at January 1, 2012 $ 96 $ 39 $262 $580 $ 977
Return on assets held at end of year 3 (1) 9 (5) 6
Return on assets sold during the year 3 1 9 0 14
Purchases, sales and settlements, net (26) (29) 62 14 21
Transfers, net (2) (5) (0) (3) (10)
Foreign exchange impact 1 (0) 11 23 34
Balance at December 31, 2012 $ 76 $ 5 $353 $609 $1,042
($ in millions)
Government
and Related
Corporate
Bonds
Private
Equity
Private
Real Estate To ta l
Balance at January 1, 2011 $ — $11 $176 $533 $720
Return on assets held at end of year 3 2 30 11 46
Return on assets sold during the year (0) (0) (2) (3) (5)
Purchases, sales and settlements, net 100 28 65 44 237
Transfers, net — — (0) 0 0
Foreign exchange impact (7) (2) (7) (6) (22)
Balance at December 31, 2011 $ 96 $39 $262 $580 $977