IBM 2012 Annual Report Download - page 50
Download and view the complete annual report
Please find page 50 of the 2012 IBM annual report below. You can navigate through the pages in the report by either clicking on the pages listed below, or by using the keyword search tool below to find specific information within the annual report.-
 1
1 -
2
-
3
-
4
-
5
-
6
-
7
-
8
-
9
-
10
-
11
-
12
-
13
-
14
-
15
-
16
-
17
-
18
-
19
-
20
-
21
-
22
-
23
-
24
-
25
-
26
-
27
-
28
-
29
-
30
-
31
-
32
-
33
-
34
-
35
-
36
-
37
-
38
-
39
-
 40
40 -
 41
41 -
 42
42 -
 43
43 -
 44
44 -
 45
45 -
 46
46 -
 47
47 -
 48
48 -
 49
49 -
 50
50 -
 51
51 -
 52
52 -
 53
53 -
 54
54 -
 55
55 -
 56
56 -
 57
57 -
 58
58 -
 59
59 -
 60
60 -
61
-
62
-
63
-
64
-
65
-
66
-
67
-
68
-
69
-
70
-
71
-
72
-
73
-
74
-
75
-
76
-
77
-
78
-
79
-
80
-
81
-
82
-
83
-
84
-
85
-
86
-
87
-
88
-
89
-
90
-
91
-
92
-
93
-
94
-
95
-
96
-
97
-
98
-
99
-
100
-
101
-
102
-
103
-
104
-
105
-
106
-
107
-
108
-
109
-
110
-
111
-
112
-
113
-
114
-
115
-
116
-
117
-
118
-
119
-
120
-
121
-
122
-
123
-
124
-
125
-
126
-
127
-
128
-
129
-
130
-
131
-
132
-
133
-
134
-
135
-
136
-
137
-
138
-
139
-
140
-
141
-
142
-
143
-
144
-
145
-
146
 |
 |

49
Management Discussion
International Business Machines Corporation and Subsidiary Companies
Information Management revenue increased 12.5 percent
(10 percent adjusted for currency) and gained share in 2011 com-
pared to 2010. Distributed Database revenue increased 33 percent
in 2011, led by strong performance from the Netezza offerings.
Since acquiring Netezza in November 2010, the Software business
has expanded the Netezza customer base by over 40 percent. The
company’s business analytics software offerings, most of which
are part of Information Management, continued to outpace the
market with double-digit revenue growth, year to year in 2011.
Lotus revenue increased 3.8 percent (flat adjusted for currency)
in 2011 compared to 2010, with growth driven by the Social Business
offerings.
Tivoli revenue increased 10.2 percent (7 percent adjusted for
currency) in 2011 when compared to 2010 and gained share. Rev-
enue growth was led by Storage software with growth of 25 percent
(22 percent adjusted for currency). Security solutions software
also delivered growth in 2011, with revenue up 9 percent (6 percent
adjusted for currency).
Rational revenue increased 4.9 percent (2 percent adjusted for
currency) in 2011 versus 2010 and gained share. Revenue growth
was driven by Telelogic, which increased 11 percent (7 percent
adjusted for currency) year to year.
Operating systems revenue increased 8.6 percent (6 percent
adjusted for currency) in 2011 compared to 2010, driven primarily by
growth in Power Systems.
Other software revenue increased 3.2 percent (flat adjusted for
currency) with growth in software-related services partially offset
by the divestiture of the PLM operations in the first quarter of 2010.
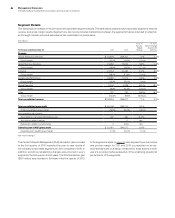
($ in millions)
For the year ended December 31: 2011 2010
Yr.-to-Yr.
Percent/
Margin
Change
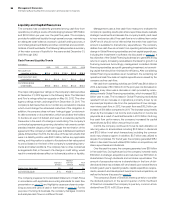
Software
External gross profit $22,065 $19,774 11.6%
External gross profit margin 88.5% 87.9% 0.5 pts.
Pre-tax income $ 9,970 $ 9,466 5.3%
Pre-tax margin 35.3% 37.2%(1.9 )pts.
Pre-tax income-normalized* $10,009 $ 8,972 11.6%
Pre-tax margin—normalized 35.5%35.3%0.2 pts.
* Excludes $39 million and $98 million of workforce rebalancing charges in the first
quarter of 2011 and 2010, respectively, and $(591) million related to the PLM gain in the
first quarter of 2010.
Software gross profit increased 11.6 percent to $22,065 million in
2011 driven primarily by the growth in revenue. Gross profit margin
improved 0.5 points versus 2010. Software delivered segment
pre-tax income of $9,970 million in 2011, an increase of 5.3 percent
versus 2010. On a normalized basis, segment pre-tax income
increased 11.6 percent and segment pre-tax margin improved
0.2 points to 35.5 percent in 2011. The Software segment delivered
strong margin and profit growth in 2011 and contributed to the
company’s continued margin expansion and profit performance.
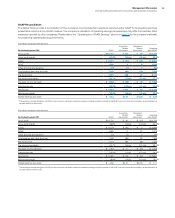
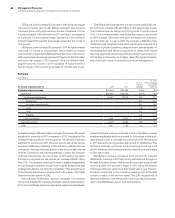
Systems and Technology
($ in millions)
For the year ended December 31: 2011*2010*
Yr.-to-Yr.
Percent
Change
Yr.-to-Yr.
Percent Change
Adjusted for
Currency
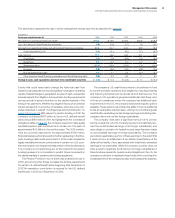
Systems and Technology external revenue $18,985 $17,973 5.6% 3.2%
System z 0.3% (2.1)%
Power Systems 12.0 9.5
System x 5.7 2.4
Storage 5.8 3.1
Total Systems excluding Retail Store Solutions 6.3 3.5
Microelectronics OEM 0.2 0.1
Total Systems and Technology excluding Retail Store Solutions 5.4 3.0
Retail Store Solutions (Divested in 2012) 11.6 9.4
* Reclassified to conform with 2012 presentation.
Systems and Technology revenue increased 5.6 percent (3 percent
adjusted for currency) in 2011 versus 2010. Performance in 2011
was driven by the growth markets which increased 14.9 percent
(12 percent adjusted for currency). The major markets increased
2.7 percent, but were essentially flat at constant currency versus
the prior year period.
System z revenue increased 0.3 percent (down 2 percent
adjusted for currency) in 2011 versus 2010. MIPS shipments
increased 16 percent in 2011 versus 2010. The revenue performance
and lower MIPS growth was a result of the strong prior-year perfor-
mance and was consistent with prior mainframe product cycles, as
the company successfully launched its zEnterprise 196 (z196) server
in the third quarter of 2010. Since the z196 server began shipping,
the company added over 115 new System z clients, with more than
33 percent in the growth markets through year-end 2011.