IBM 2012 Annual Report Download - page 103
Download and view the complete annual report
Please find page 103 of the 2012 IBM annual report below. You can navigate through the pages in the report by either clicking on the pages listed below, or by using the keyword search tool below to find specific information within the annual report.-
 1
1 -
2
-
3
-
4
-
5
-
6
-
7
-
8
-
9
-
10
-
11
-
12
-
13
-
14
-
15
-
16
-
17
-
18
-
19
-
20
-
21
-
22
-
23
-
24
-
25
-
26
-
27
-
28
-
29
-
30
-
31
-
32
-
33
-
34
-
35
-
36
-
37
-
38
-
39
-
40
-
41
-
42
-
43
-
44
-
45
-
46
-
47
-
48
-
49
-
50
-
51
-
52
-
53
-
54
-
55
-
56
-
57
-
58
-
59
-
60
-
61
-
62
-
63
-
64
-
65
-
66
-
67
-
68
-
69
-
70
-
71
-
72
-
73
-
74
-
75
-
76
-
77
-
78
-
79
-
80
-
81
-
82
-
83
-
84
-
85
-
86
-
87
-
88
-
89
-
90
-
91
-
92
-
 93
93 -
 94
94 -
 95
95 -
 96
96 -
 97
97 -
 98
98 -
 99
99 -
 100
100 -
 101
101 -
 102
102 -
 103
103 -
 104
104 -
 105
105 -
 106
106 -
 107
107 -
 108
108 -
 109
109 -
 110
110 -
 111
111 -
 112
112 -
 113
113 -
114
-
115
-
116
-
117
-
118
-
119
-
120
-
121
-
122
-
123
-
124
-
125
-
126
-
127
-
128
-
129
-
130
-
131
-
132
-
133
-
134
-
135
-
136
-
137
-
138
-
139
-
140
-
141
-
142
-
143
-
144
-
145
-
146
 |
 |

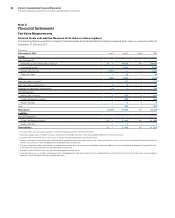
102 Notes to Consolidated Financial Statements
International Business Machines Corporation and Subsidiary Companies
102
($ in millions)
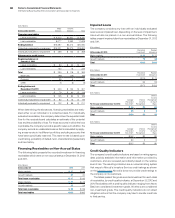
At December 31, 2011:
Tota l
Past Due
> 90 Days* Current
Tota l
Financing
Receivables
Recorded
Investment
> 90 Days
and Accruing
Major markets $ 6 $ 6,504 $ 6,510 $ 6
Growth markets 9 1,911 1,921 6
Total lease receivables $16 $ 8,415 $ 8,430 $12
Major markets $23 $ 9,054 $ 9,077 $ 7
Growth markets 22 2,530 2,552 19
Total loan receivables $46 $11,584 $11,629 $26
To t a l $62 $19,998 $20,060 $38
* Does not include accounts that are fully reserved.
Troubled Debt Restructurings
The company assessed all restructurings that occurred on or after
January 1, 2011 and determined that there were no troubled debt
restructurings for the years ended December 31, 2011 and 2012.
Note G.
Property, Plant and Equipment
($ in millions)
At December 31: 2012 2011
Land and land improvements $ 747 $ 786
Buildings and building improvements 9,610 9,531
Plant, laboratory and office equipment 27,731 26,843
Plant and other property—gross 38,088 37,160
Less: Accumulated depreciation 25,234 24,703
Plant and other property—net 12,854 12,457
Rental machines 2,414 2,964
Less: Accumulated depreciation 1,271 1,538
Rental machines—net 1,142 1,426
Total—net $13,996 $13,883
Note H.
Investments and Sundry Assets
($ in millions)
At December 31: 2012 2011
Deferred transition and setup costs
and other deferred arrangements* $1,630 $1,784
Derivatives—noncurrent ** 585 753
Alliance investments
Equity method 120 131
Non-equity method 226 127
Prepaid software 306 233
Long-term deposits 318 307
Other receivables 204 208
Employee benefit-related 439 493
Prepaid income taxes 459 261
Other assets 735 598
To t a l $5,021 $4,895
* Deferred transition and setup costs and other deferred arrangements are related to
Global Services client arrangements. See note A, “Significant Accounting Policies,”
on page 79 for additional information.
**
See note D, “Financial Instruments,” on pages 94 through 98 for the fair value of all
derivatives reported in the Consolidated Statement of Financial Position.
Note I.
Intangible Assets Including Goodwill
Intangible Assets
The following table details the company’s intangible asset balances
by major asset class.
($ in millions)
At December 31, 2012:
Gross
Carrying
Amount
Accumulated
Amortization
Net
Carrying
Amount
Intangible asset class
Capitalized software $1,527 $ (665) $ 861
Client relationships 2,103 (961) 1,142
Completed technology 2,709 (1,112) 1,597
In-process R&D 28 — 28
Patents/trademarks 281 (127) 154
Other* 31 (27) 3
To t a l $6,679 $(2,892) $3,787