IBM 2012 Annual Report Download - page 117
Download and view the complete annual report
Please find page 117 of the 2012 IBM annual report below. You can navigate through the pages in the report by either clicking on the pages listed below, or by using the keyword search tool below to find specific information within the annual report.-
 1
1 -
2
-
3
-
4
-
5
-
6
-
7
-
8
-
9
-
10
-
11
-
12
-
13
-
14
-
15
-
16
-
17
-
18
-
19
-
20
-
21
-
22
-
23
-
24
-
25
-
26
-
27
-
28
-
29
-
30
-
31
-
32
-
33
-
34
-
35
-
36
-
37
-
38
-
39
-
40
-
41
-
42
-
43
-
44
-
45
-
46
-
47
-
48
-
49
-
50
-
51
-
52
-
53
-
54
-
55
-
56
-
57
-
58
-
59
-
60
-
61
-
62
-
63
-
64
-
65
-
66
-
67
-
68
-
69
-
70
-
71
-
72
-
73
-
74
-
75
-
76
-
77
-
78
-
79
-
80
-
81
-
82
-
83
-
84
-
85
-
86
-
87
-
88
-
89
-
90
-
91
-
92
-
93
-
94
-
95
-
96
-
97
-
98
-
99
-
100
-
101
-
102
-
103
-
104
-
105
-
106
-
 107
107 -
 108
108 -
 109
109 -
 110
110 -
 111
111 -
 112
112 -
 113
113 -
 114
114 -
 115
115 -
 116
116 -
 117
117 -
 118
118 -
 119
119 -
 120
120 -
 121
121 -
 122
122 -
 123
123 -
 124
124 -
 125
125 -
 126
126 -
 127
127 -
128
-
129
-
130
-
131
-
132
-
133
-
134
-
135
-
136
-
137
-
138
-
139
-
140
-
141
-
142
-
143
-
144
-
145
-
146
 |
 |

116 Notes to Consolidated Financial Statements
International Business Machines Corporation and Subsidiary Companies
116
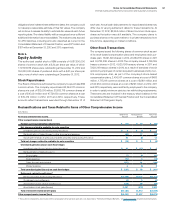
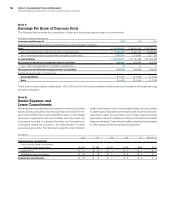
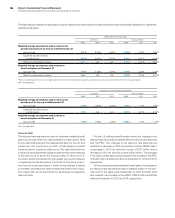
Note P.
Earnings Per Share of Common Stock
The following table presents the computation of basic and diluted earnings per share of common stock.
($ in millions except per share amounts)
For the year ended December 31: 2012 2011 2010
Weighted-average number of shares on which earnings per share calculations are based
Basic 1,142,508,521 1,196,951,006 1,268,789,202
Add—incremental shares under stock-based compensation plans 10,868,426 14,241,131 16,189,053
Add—incremental shares associated with contingently issuable shares 2,072,370 2,575,848 2,377,133
Assuming dilution 1,155,449,317 1,213,767,985 1,287,355,388
Net income on which basic earnings per share is calculated $16,604 $15,855 $14,833
Less—net income applicable to contingently issuable shares (1) 0 0
Net income on which diluted earnings per share is calculated $16,603 $15,855 $14,833
Earnings/(loss) per share of common stock
Assuming dilution $ 14.37 $ 13.06 $ 11.52
Basic $ 14.53 $ 13.25 $ 11.69
There were no stock options outstanding in 2012, 2011 and 2010 that were considered antidilutive and not included in the diluted earnings
per share calculation.
Note Q.
Rental Expense and
Lease Commitments
Rental expense, including amounts charged to inventories and fixed
assets, and excluding amounts previously reserved, was $1,767 mil-
lion in 2012, $1,836 million in 2011 and $1,727 million in 2010. Rental
expense in agreements with rent holidays and scheduled rent
increases is recorded on a straight-line basis over the lease term.
Contingent rentals are included in the determination of rental
expense as accruable. The table below depicts gross minimum
rental commitments under noncancelable leases, amounts related
to vacant space associated with infrastructure reductions and spe-
cial actions taken through 1994, and in 1999, 2002 and 2005
(previously reserved), sublease income commitments and capital
lease commitments. These amounts reflect activities primarily related
to office space, as well as manufacturing facilities.
($ in millions)
2013 2014 2015 2016 2017 Beyond 2017
Operating lease commitments
Gross minimum rental commitments
(including vacant space below) $1,466 $1,268 $1,044 $746 $535 $747
Vacant space $ 21 $ 13 $ 7 $ 3 $ 1 $ 0
Sublease income commitments $ 26 $ 16 $ 11 $ 9 $ 4 $ 1
Capital lease commitments $ 13 $ 12 $ 11 $ 8 $ 10 $ 6