IBM 2012 Annual Report Download - page 115
Download and view the complete annual report
Please find page 115 of the 2012 IBM annual report below. You can navigate through the pages in the report by either clicking on the pages listed below, or by using the keyword search tool below to find specific information within the annual report.-
 1
1 -
2
-
3
-
4
-
5
-
6
-
7
-
8
-
9
-
10
-
11
-
12
-
13
-
14
-
15
-
16
-
17
-
18
-
19
-
20
-
21
-
22
-
23
-
24
-
25
-
26
-
27
-
28
-
29
-
30
-
31
-
32
-
33
-
34
-
35
-
36
-
37
-
38
-
39
-
40
-
41
-
42
-
43
-
44
-
45
-
46
-
47
-
48
-
49
-
50
-
51
-
52
-
53
-
54
-
55
-
56
-
57
-
58
-
59
-
60
-
61
-
62
-
63
-
64
-
65
-
66
-
67
-
68
-
69
-
70
-
71
-
72
-
73
-
74
-
75
-
76
-
77
-
78
-
79
-
80
-
81
-
82
-
83
-
84
-
85
-
86
-
87
-
88
-
89
-
90
-
91
-
92
-
93
-
94
-
95
-
96
-
97
-
98
-
99
-
100
-
101
-
102
-
103
-
104
-
 105
105 -
 106
106 -
 107
107 -
 108
108 -
 109
109 -
 110
110 -
 111
111 -
 112
112 -
 113
113 -
 114
114 -
 115
115 -
 116
116 -
 117
117 -
 118
118 -
 119
119 -
 120
120 -
 121
121 -
 122
122 -
 123
123 -
 124
124 -
 125
125 -
126
-
127
-
128
-
129
-
130
-
131
-
132
-
133
-
134
-
135
-
136
-
137
-
138
-
139
-
140
-
141
-
142
-
143
-
144
-
145
-
146
 |
 |

114 Notes to Consolidated Financial Statements
International Business Machines Corporation and Subsidiary Companies
114
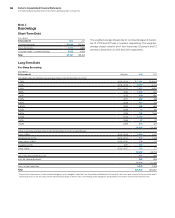
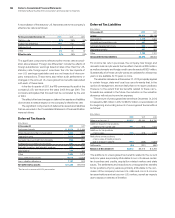
Deferred Tax Liabilities
($ in millions)
At December 31: 2012 2011
Leases $2,216 $2,149
Depreciation 1,378 1,421
Goodwill and intangible assets 957 796
Software development costs 542 466
Retirement benefits 257 551
Other 1,158 1,121
Gross deferred tax liabilities $6,508 $6,504
For income tax return purposes, the company has foreign and
domestic loss carryforwards, the tax effect of which is $706 million,
as well as domestic and foreign credit carryforwards of $929 million.
Substantially all of these carryforwards are available for at least two
years or are available for 10 years or more.
The valuation allowance at December 31, 2012 principally applies
to certain foreign, state and local loss carryforwards that, in the
opinion of management, are more likely than not to expire unutilized.
However, to the extent that tax benefits related to these carry-
forwards are realized in the future, the reduction in the valuation
allowance will reduce income tax expense.
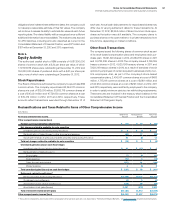
The amount of unrecognized tax benefits at December 31, 2012
increased by $97 million in 2012 to $5,672 million. A reconciliation of
the beginning and ending amount of unrecognized tax benefits is
as follows:
($ in millions)
2012 2011 2010
Balance at January 1 $5,575 $5,293 $ 4,790
Additions based on tax positions
related to the current year 401 672 1,054
Additions for tax positions
of prior years 215 379 1,768
Reductions for tax positions
of prior years (including impacts
due to a lapse in statute) (425) (538) (1,659)
Settlements (94) (231) (660)
Balance at December 31 $5,672 $5,575 $ 5,293
The additions to unrecognized tax benefits related to the current
and prior years are primarily attributable to non-U.S. issues, certain
tax incentives and credits, acquisition-related matters and state
issues. The settlements and reductions to unrecognized tax benefits
for tax positions of prior years are primarily attributable to the con-
clusion of the company’s various U.S., state and non-U.S. income
tax examinations and various non-U.S. matters, as well as impacts
due to lapses in statutes of limitation.
A reconciliation of the statutory U.S. federal tax rate to the company’s
effective tax rate is as follows:
For the year ended December 31: 2012 2011 2010
Statutory rate 35% 35% 35%
Foreign tax differential (11) (10) (10)
State and local 12 2
Other (1) (2) (2)
Effective rate 24% 25% 25%
The significant components reflected within the tax rate reconcili-
ation above labeled “Foreign tax differential” include the effects of
foreign subsidiaries’ earnings taxed at rates other than the U.S.
statutory rate, foreign export incentives, the U.S. tax impacts of
non-U.S. earnings repatriation and any net impacts of intercom-
pany transactions. These items also reflect audit settlements or
changes in the amount of unrecognized tax benefits associated
with each of these items.
In the fourth quarter of 2011, the IRS commenced its audit of the
company’s U.S. tax returns for the years 2008 through 2010. The
company anticipates that this audit will be completed by the end
of 2013.
The effect of tax law changes on deferred tax assets and liabilities
did not have a material impact on the company’s effective tax rate.
The significant components of deferred tax assets and liabilities
that are recorded in the Consolidated Statement of Financial Position
were as follows:
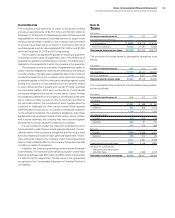
Deferred Tax Assets
($ in millions)
At December 31: 2012 2011*
Retirement benefits $ 5,870 $ 5,169
Share-based and other compensation 1,666 1,598
Deferred income 1,018 834
Domestic tax loss/credit carryforwards 954 914
Foreign tax loss/credit carryforwards 681 752
Bad debt, inventory and warranty reserves 586 608
Depreciation 456 474
Other 1,384 1,479
Gross deferred tax assets 12,615 11,828
Less: valuation allowance 1,187 912
Net deferred tax assets $11,428 $10,916
* Reclassed to conform with 2012 presentation.