IBM 2012 Annual Report Download - page 38
Download and view the complete annual report
Please find page 38 of the 2012 IBM annual report below. You can navigate through the pages in the report by either clicking on the pages listed below, or by using the keyword search tool below to find specific information within the annual report.-
 1
1 -
2
-
3
-
4
-
5
-
6
-
7
-
8
-
9
-
10
-
11
-
12
-
13
-
14
-
15
-
16
-
17
-
18
-
19
-
20
-
21
-
22
-
23
-
24
-
25
-
26
-
27
-
 28
28 -
 29
29 -
 30
30 -
 31
31 -
 32
32 -
 33
33 -
 34
34 -
 35
35 -
 36
36 -
 37
37 -
 38
38 -
 39
39 -
 40
40 -
 41
41 -
 42
42 -
 43
43 -
 44
44 -
 45
45 -
 46
46 -
 47
47 -
 48
48 -
49
-
50
-
51
-
52
-
53
-
54
-
55
-
56
-
57
-
58
-
59
-
60
-
61
-
62
-
63
-
64
-
65
-
66
-
67
-
68
-
69
-
70
-
71
-
72
-
73
-
74
-
75
-
76
-
77
-
78
-
79
-
80
-
81
-
82
-
83
-
84
-
85
-
86
-
87
-
88
-
89
-
90
-
91
-
92
-
93
-
94
-
95
-
96
-
97
-
98
-
99
-
100
-
101
-
102
-
103
-
104
-
105
-
106
-
107
-
108
-
109
-
110
-
111
-
112
-
113
-
114
-
115
-
116
-
117
-
118
-
119
-
120
-
121
-
122
-
123
-
124
-
125
-
126
-
127
-
128
-
129
-
130
-
131
-
132
-
133
-
134
-
135
-
136
-
137
-
138
-
139
-
140
-
141
-
142
-
143
-
144
-
145
-
146
 |
 |

37
Management Discussion
International Business Machines Corporation and Subsidiary Companies
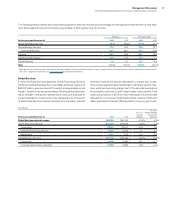
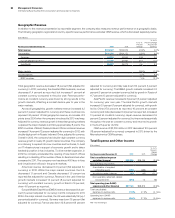
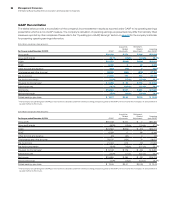
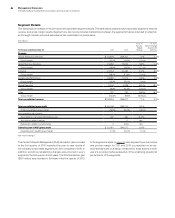
Noncurrent Assets and Liabilities
($ in millions)
At December 31: 2012 2011
Noncurrent assets $69,780 $65,505
Long-term debt $24,088 $22,857
Noncurrent liabilities (excluding debt) $32,516 $31,217
The increase in noncurrent assets of $4,276 million ($4,454 million
adjusted for currency) was driven by:
• An increase of $3,429 million ($3,236 million adjusted
for currency) in goodwill and intangible assets driven by
acquisitions;
• An increase of $470 million in deferred taxes ($580 million
adjusted for currency) driven by retirement-related
activity; and
• An increase of $2,036 million in financing receivables
($2,214 million adjusted for currency) driven by increased
volumes, partially offset by
• A decrease of $1,899 million in prepaid pension assets
($1,922 million adjusted for currency) primarily driven by plan
remeasurements.
Long-term debt increased by $1,231 million primarily driven by new
debt issuances of $7,700 million, partially offset by reclasses to
short-term debt of $5,638 million, and debt repurchased as a result
of the debt exchange of $665 million.
Other noncurrent liabilities, excluding debt, increased $1,299
million ($1,558 million adjusted for currency) primarily driven by:
• An increase in retirement and nonpension benefit obligations
of $2,044 million ($2,264 million adjusted for currency)
as a result of pension remeasurements; and
• An increase in deferred income of $644 million driven by
services and software arrangements; partially offset by
• A decrease of $1,389 million in other liabilities driven
by a reclass of tax-related liabilities to short term.
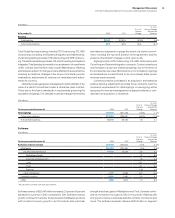
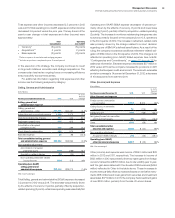
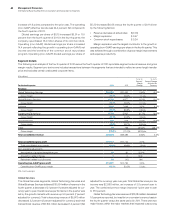
Debt
The company’s funding requirements are continually monitored and
strategies are executed to manage the overall asset and liability
profile. Additionally, the company maintains sufficient flexibility to
access global funding sources as needed.
($ in millions)
At December 31: 2012 2011
Total company debt $33,269 $31,320
Total Global Financing segment debt $24,501 $23,332
Debt to support external clients 21,583 20,051
Debt to support internal clients 2,919 3,281
Global Financing provides financing predominantly for the com-
pany’s external client assets, as well as for assets under contract by
other IBM units. These assets, primarily for Global Services, gener-
ate long-term, stable revenue streams similar to the Global Financing
asset portfolio. Based on their attributes, these Global Services
assets are leveraged with the balance of the Global Financing asset
base. The debt analysis in the previous column is further detailed in
the Global Financing section on pages 66 and 67.
Given the significant leverage, the company presents a debt-to-
capitalization ratio which excludes Global Financing debt and equity
as management believes this is more representative of the com-
pany’s core business operations. This ratio can vary from period to
period as the company manages its global cash and debt positions.
“Core” debt-to-capitalization ratio (excluding Global Financing
debt and equity) was 36.1 percent at December 31, 2012 compared
to 32.0 percent at December 31, 2011. The increase was primarily
driven by an increase in non-Global Financing debt of $780 million
and a decrease in non-Global Financing equity of $1,497 million from
the December 31, 2011 balances.
Consolidated debt-to-capitalization ratio at December 31, 2012
was 63.7 percent versus 60.7 percent at December 31, 2011.
The increase in both the “core” debt-to-capitalization ratio and
the consolidated debt-to-capitalization ratio was impacted by the
$5.2 billion impact to equity as a result of retirement-related plan
remeasurements in December.
Debt Exchange
In the second quarter of 2012, the company completed an exchange
of approximately $6 million of principal of its 7.125 percent deben-
tures due in 2096, $104 million principal of its 8.00 percent notes
due in 2038 and $800 million of principal of its 5.60 percent senior
notes due in 2039 for approximately $1,107 million of 4.00 percent
senior notes due in 2042 and cash of approximately $121 million.
The exchange was completed to retire high coupon debt in the
current favorable interest rate environment.
The debt exchange was accounted for as a non-revolving debt
modification in accordance with accounting guidance, and therefore
it did not result in any gain or loss recorded in the Consolidated
Statement of Earnings. Cash payments will be amortized over the
life of the new debt. Administrative fees with third parties in relation
to the exchange were expensed as incurred.
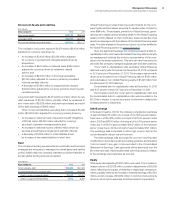
Equity
Total equity decreased by $1,252 million as a result of an increase in
treasury stock of $12,168 million; pension adjustments of $3,669
million reflecting the impact of retirement-related plan remeasure-
ments; partially offset by an increase in retained earnings of $12,783
million, and an increase of $1,980 million in common stock primarily
driven by stock option exercises and stock based compensation.