IBM 2012 Annual Report Download - page 66
Download and view the complete annual report
Please find page 66 of the 2012 IBM annual report below. You can navigate through the pages in the report by either clicking on the pages listed below, or by using the keyword search tool below to find specific information within the annual report.-
 1
1 -
2
-
3
-
4
-
5
-
6
-
7
-
8
-
9
-
10
-
11
-
12
-
13
-
14
-
15
-
16
-
17
-
18
-
19
-
20
-
21
-
22
-
23
-
24
-
25
-
26
-
27
-
28
-
29
-
30
-
31
-
32
-
33
-
34
-
35
-
36
-
37
-
38
-
39
-
40
-
41
-
42
-
43
-
44
-
45
-
46
-
47
-
48
-
49
-
50
-
51
-
52
-
53
-
54
-
55
-
 56
56 -
 57
57 -
 58
58 -
 59
59 -
 60
60 -
 61
61 -
 62
62 -
 63
63 -
 64
64 -
 65
65 -
 66
66 -
 67
67 -
 68
68 -
 69
69 -
 70
70 -
 71
71 -
 72
72 -
 73
73 -
 74
74 -
 75
75 -
 76
76 -
77
-
78
-
79
-
80
-
81
-
82
-
83
-
84
-
85
-
86
-
87
-
88
-
89
-
90
-
91
-
92
-
93
-
94
-
95
-
96
-
97
-
98
-
99
-
100
-
101
-
102
-
103
-
104
-
105
-
106
-
107
-
108
-
109
-
110
-
111
-
112
-
113
-
114
-
115
-
116
-
117
-
118
-
119
-
120
-
121
-
122
-
123
-
124
-
125
-
126
-
127
-
128
-
129
-
130
-
131
-
132
-
133
-
134
-
135
-
136
-
137
-
138
-
139
-
140
-
141
-
142
-
143
-
144
-
145
-
146
 |
 |

65
Management Discussion
International Business Machines Corporation and Subsidiary Companies
Commercial financing receivables arise primarily from inventory
and accounts receivable financing for dealers and remarketers of
IBM and non-IBM products. Payment terms for inventory financing
and accounts receivable financing generally range from 30 to 90
days. These short-term receivables are primarily unsecured and are
also subjected to additional credit analysis in order to evaluate the
associated risk.
In addition to the actions described above, in certain circum-
stances, the company may take mitigation actions to transfer credit
risk to third parties.
At December 31, 2012, substantially all financing assets were IT
related assets, and approximately 60 percent of the external port-
folio was with investment grade clients with no direct exposure to
consumers or mortgage assets.
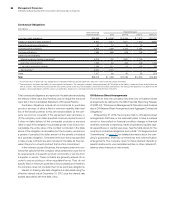
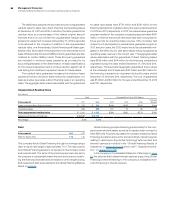
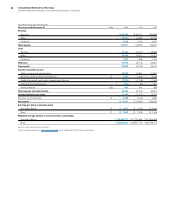
Originations
The following are total financing originations.
($ in millions)
For the year ended December 31: 2012 2011 2010
Client financing $16,277 $14,390 $12,748
Commercial financing 36,944 35,282 32,366
To t a l $53,222 $49,673 $45,113
In 2012, new financing originations exceeded cash collections for
both client and commercial financing. This resulted in a net increase
in total financing assets from December 31, 2011. The increase in
originations in both 2012 versus 2011 and 2011 versus 2010 was due
to improving external volumes in both client and commercial financ-
ing. Internal loan financing with Global Services is executed under
a loan facility and is not considered originations.
Cash generated by Global Financing in 2012 was primarily
deployed to pay the intercompany payables and dividends to IBM.
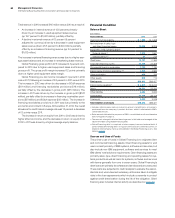
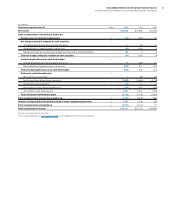
Global Financing Receivables and Allowances
The following table presents external financing receivables excluding
residual values, and the allowance for credit losses.
($ in millions)
At December 31: 2012 2011
Gross financing receivables $30,621 $27,366
Specific allowance for credit losses 240 226
Unallocated allowance for credit losses 115 124
Total allowance for credit losses 355 350
Net financing receivables $30,266 $27,016
Allowance for credit losses coverage 1.2% 1.3%
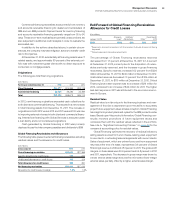
Roll Forward of Global Financing Receivables
Allowance for Credit Losses
($ in millions)
January 1, 2012
Allowance
Used*
Additions/
(Reductions) Other**
December 31,
2012
$350 $(19 ) $26 $(1 ) $355
* Represents reserved receivables, net of recoveries, that were disposed of during
the period.
** Primarily represents translation adjustments.
The percentage of Global Financing receivables reserved
decreased from 1.3 percent at December 31, 2011 to 1.2 percent
at December 31, 2012 primarily due to the disposition of receiv-
ables previously reserved, and the increase in gross financing
receivables. Specific reserves increased 6.2 percent from $226
million at December 31, 2011 to $240 million at December 31, 2012.
Unallocated reserves decreased 7.3 percent from $124 million at
December 31, 2011, to $115 million at December 31, 2012. Global
Financing’s bad debt expense was an increase of $26 million for
2012, compared to an increase of $42 million for 2011. The higher
bad debt expense in 2011 was attributed to the economic environ-
ment in Europe.
Residual Value
Residual value is a risk unique to the financing business and man-
agement of this risk is dependent upon the ability to accurately
project future equipment values at lease inception. Global Financing
has insight into product plans and cycles for the IBM products under
lease. Based upon this product information, Global Financing con-
tinually monitors projections of future equipment values and
compares them with the residual values reflected in the portfolio.
See note A, “Significant Accounting Policies,” on page 86 for the
company’s accounting policy for residual values.
Global Financing optimizes the recovery of residual values by
selling assets sourced from end of lease, leasing used equipment
to new clients, or extending lease arrangements with current clients.
Sales of equipment, which are primarily sourced from equipment
returned at the end of a lease, represented 51.6 percent of Global
Financing’s revenue in 2012 and 48.1 percent in 2011. The gross profit
margins on these sales were 53.6 percent and 54.8 percent in 2012
and 2011, respectively. The decrease in gross margin was driven by
a lower internal sales margin and a shift in mix toward lower margin
external sales, partially offset by a higher external sales margin.